March 25, 2026 a 05:08 am
EURCHF: Fibonacci Analysis
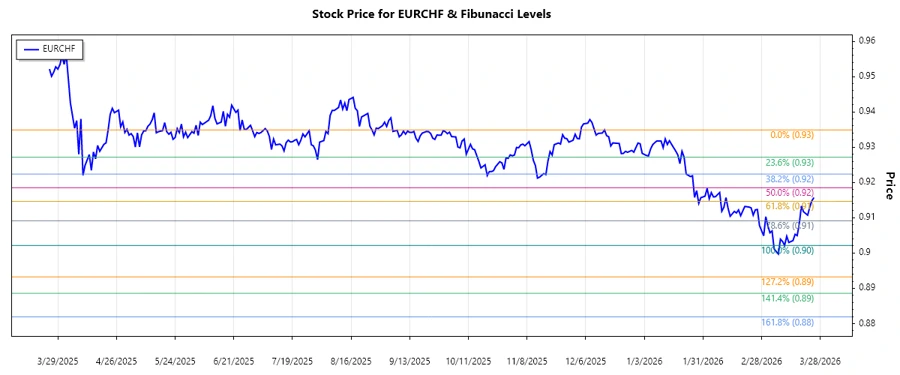
The EURCHF currency pair has shown a significant downward trend over the analyzed period. With increasing market volatility, there's a noticeable pressure on the Euro compared to the Swiss Franc. This analysis will delve into the technical aspects and prospects of the pair, with a focus on potential price reversals or continuations.
Fibonacci Analysis
| Aspect | Detail |
|---|---|
| Trend Dates | From 2025-12-15 to 2026-03-25 |
| High Point | 0.93488 on 2025-12-15 |
| Low Point | 0.90214 on 2026-03-11 |
| Fibonacci Levels |
|
| Current Price | 0.91571 |
| Retracement Zone | 0.382 |
| Technical Interpretation | The EURCHF is currently within the 0.382 retracement level, suggesting a possible resistance at this point. A break above could signal strength, while failure to do so may lead to continuation of the downtrend. |
Conclusion
The declining trend of the EURCHF reflects underlying market sentiments and external economic factors affecting the Eurozone. The current position of the currency within the Fibonacci retracement levels hints at potential reversals or continuations contingent on prevailing economic conditions and investor sentiments. For analysts, this presents both challenges and opportunities to anticipate market movements effectively. Monitoring key levels is crucial, as breakouts could redefine the currency's trajectory, presenting valuable trading opportunities.