January 22, 2026 a 05:08 am
EURCHF: Fibonacci Analysis
The EURCHF currency pair has shown fluctuations influenced by economic indicators and market sentiment. Over the recent months, it has experienced a downward trend, with potential implications for traders focusing on support and resistance levels. Understanding these movements is crucial for effective trading strategies, especially when considering technical indicators such as Fibonacci retracements.
Fibonacci Analysis
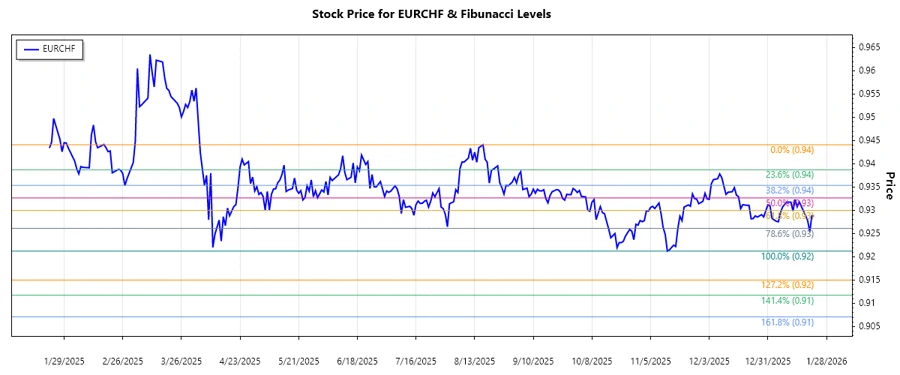
The following analysis focuses on the recent dominant downward trend observed in the EURCHF pair. Using Fibonacci retracement, key levels have been calculated to aid in identifying potential support and resistance areas.
| Detail | Information | ||||||||||||
|---|---|---|---|---|---|---|---|---|---|---|---|---|---|
| Trend Start Date | 2025-08-17 | ||||||||||||
| Trend End Date | 2026-01-22 | ||||||||||||
| High Price (Date) | 0.94411 (2025-08-17) | ||||||||||||
| Low Price (Date) | 0.92123 (2025-11-13) | ||||||||||||
| Fibonacci Levels |
|
||||||||||||
| Current Price | 0.9288 | ||||||||||||
| Retracement Zone | 0.236 | ||||||||||||
| Interpretation | The current price is in the 0.236 retracement level, suggesting a potential support level, which could imply a pause or reversal in the downward trend. |
Conclusion
The EURCHF currency pair, caught in a downward trend, has reached a potential support at the 0.236 Fibonacci retracement level. This could present an opportunity for traders to observe for signs of reversal or further consolidation. The risk remains if the pair breaches below this level, potentially targeting lower supports or continuing the existing trend. Analysts should weigh these levels against macroeconomic updates for a comprehensive strategy.