April 28, 2026 a 04:28 am

EURAUD: Trend and Support & Resistance Analysis
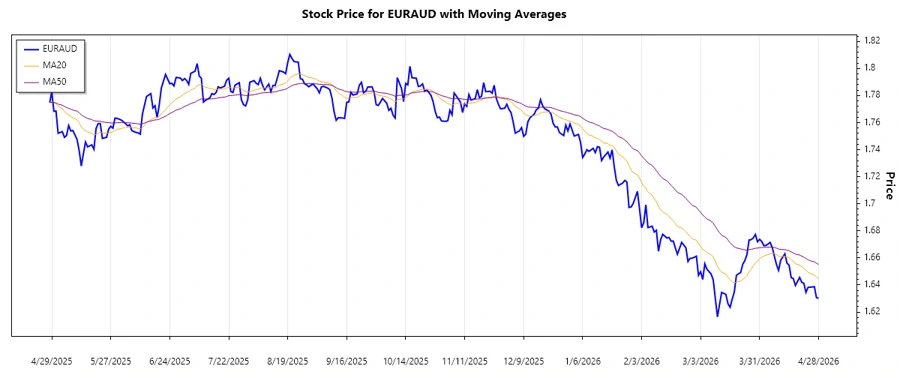
The EURAUD currency pair has experienced fluctuations over the past months, presented with both upward and downward trends. Investors should closely observe the current data to identify potential opportunities and threats in the market. The analysis of EMA20 and EMA50 will give insights into the prevailing trend, and critical support and resistance zones provide a guideline for potential pivot points.
Trend Analysis
| Date | Closing Price | Trend |
|---|---|---|
| 2026-04-28 | 1.63024 | ▼ Downtrend |
| 2026-04-27 | 1.63059 | ▼ Downtrend |
| 2026-04-26 | 1.63873 | ▼ Downtrend |
| 2026-04-24 | 1.63838 | ▼ Downtrend |
| 2026-04-23 | 1.63824 | ▼ Downtrend |
| 2026-04-22 | 1.63454 | ▼ Downtrend |
| 2026-04-21 | 1.64125 | ▼ Downtrend |
The current analysis indicates a persistent downtrend with EMA20 < EMA50 over the past week. This suggests an ongoing bearish sentiment.
Support- and Resistance
| Zone Type | Range |
|---|---|
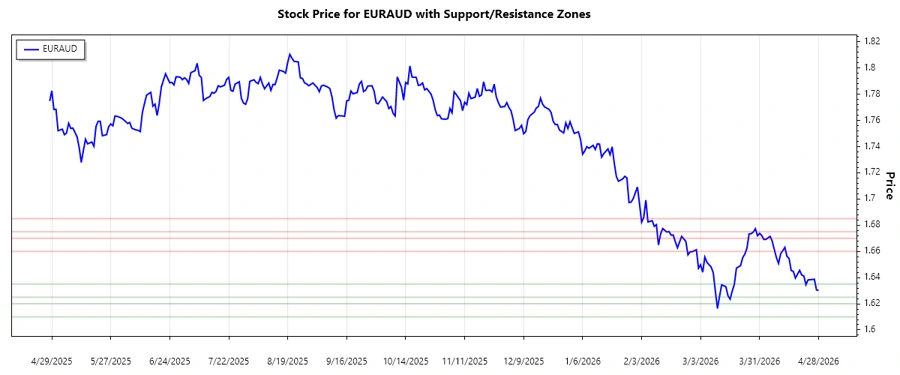
| Support 1 | 1.62500 - 1.63500 |
| Support 2 | 1.61000 - 1.62000 |
| Resistance 1 | 1.66000 - 1.67000 |
| Resistance 2 | 1.67500 - 1.68500 |
Currently, the closing price is near the first support zone. Investors should watch for potential breakdowns or bounces off this level.
Conclusion
The EURAUD's downtrend highlights potential opportunities for short positions. However, significant support and resistance levels provide areas that could reverse price movements, necessitating vigilance. Understanding these zones and trend implications is crucial for making informed trading decisions. Investors should weigh prevailing market sentiments against technical signals to balance risk and reward effectively.
This analysis, formatted for HTML, provides a structured view on the EURAUD currency trend using recent data, with emphasis on support and resistance zones, based on the provided JSON data.