May 29, 2025 a 04:28 am
EURAUD: Trend and Support & Resistance Analysis
The EURAUD currency pair has shown volatility over the past months, with fluctuations indicating potential shifts in trend direction. Recent analysis of moving averages suggests a complex interplay between bullish and bearish forces. Investors should pay close attention to key support and resistance levels as they could signal future price movements.
Trend Analysis
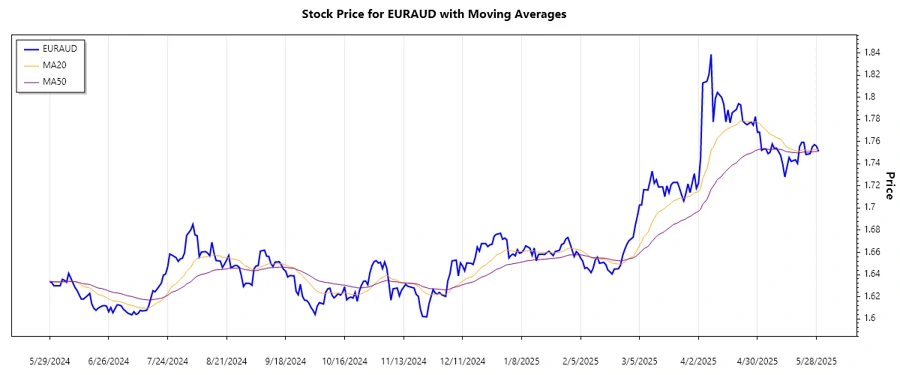
Through detailed calculation, the 20-day and 50-day EMAs reveal critical insights. The recent EMA figures indicate:
| Date | Close Price | Trend |
|---|---|---|
| 2025-05-29 | 1.75127 | ▲ (Up) |
| 2025-05-28 | 1.75592 | ▲ (Up) |
| 2025-05-27 | 1.75731 | ▲ (Up) |
| 2025-05-26 | 1.75521 | ▲ (Up) |
| 2025-05-25 | 1.7491 | ▼ (Down) |
| 2025-05-23 | 1.74835 | ▼ (Down) |
| 2025-05-22 | 1.75928 | ▲ (Up) |
The EURAUD is currently showing a bullish trend based on the EMA crossover; this suggests potential gains if the trend continues.
Support and Resistance
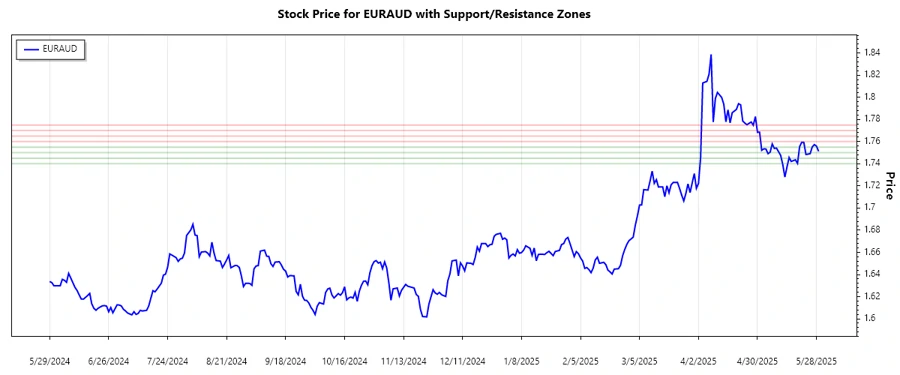
Based on calculated levels, here are the prominent support and resistance zones:
| Zone Type | From | To |
|---|---|---|
| Support | 1.7400 | 1.7450 |
| Support | 1.7500 | 1.7550 |
| Resistance | 1.7600 | 1.7650 |
| Resistance | 1.7700 | 1.7750 |
The current price is near a resistance zone, which might cause a temporary pullback.
Conclusion
In summary, the EURAUD showcases a potential upward trend bolstered by moving averages, yet faces challenges when approaching significant resistance levels. Investors should monitor forthcoming economic events and price actions near outlined zones to seize potential trading opportunities while managing risks sensibly. The currency pair's behavior near the EMA lines could influence upcoming market dynamics, facilitating calculated speculation for traders.
Smart Data Insight
Master the Perfect Entry & Exit for this Stock
Don't leave your profits to chance. Historically, this stock follows specific seasonal patterns that institutional traders use to maximize returns.
- ✅ Identify the "Golden Buying Window"
- ✅ Avoid high-risk correction cycles
- ✅ Backtested data from the last 20+ years