April 09, 2026 a 05:08 am
EURAUD: Fibonacci Analysis
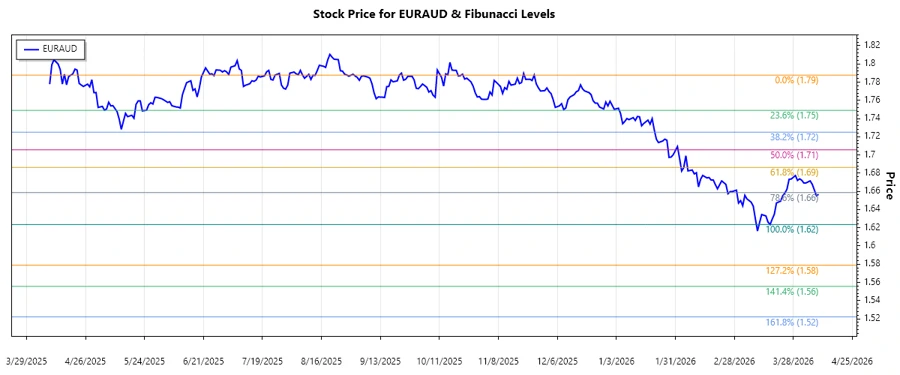
The EURAUD currency pair has shown a significant bullish trend over the recent months. Analyzing the price movement, we observe an overall uptrend starting from January 2026. The recent prices have reflected volatility, creating potential opportunities for both traders and investors. Understanding the technical aspects via Fibonacci analysis provides insights into possible retracement levels.
Fibonacci Analysis
| Detail | Information |
|---|---|
| Trend Period | 2025-11-25 to 2026-04-09 |
| High Point | 1.78765 on 2025-11-25 |
| Low Point | 1.62353 on 2026-03-17 |
| Fibonacci Levels |
|
| Current Price Retracement | 0.236 Retracement Zone |
| Technical Interpretation | The current price is hovering around the 0.236 retracement level, suggesting a potential support area. If the support holds, a continuation to higher resistance levels is possible, otherwise further downside risk could be introduced. |
Conclusion
The EURAUD has showcased a notable ascending trend, offering a glimpse into the bullish sentiment across the market. Analysts should note the critical support provided by the 0.236 Fibonacci level, as it could play a pivotal role in upcoming price directions. Any breach above the current resistance could signify strengthened upwards momentum. However, traders should remain vigilant of potential reversals upon invalidation of support levels. The EURAUD's volatility remains a determinant in planning strategic entries and exits.