February 04, 2026 a 05:08 am
EURAUD: Fibonacci Analysis
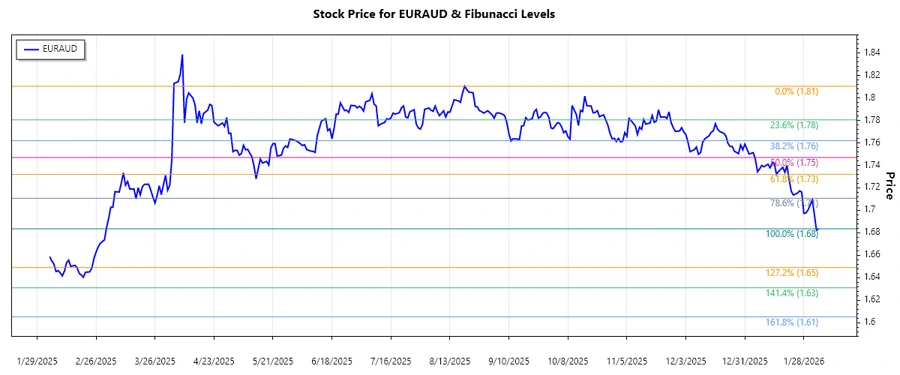
In the analysis of the EURAUD currency pair, the recent data indicates a significant downward trend. Observing the movement over time, we see consistent strengthening of the AUD against the EUR, suggesting underlying economic factors affecting Eurozone negatively or positive growth indicators in Australia. Understanding these developments can help in anticipating potential future market movements, making the technical analysis crucial for forecasts.
Fibonacci Analysis
| Details | Values |
|---|---|
| Trend Type | Downtrend |
| Start Date | 2025-08-21 |
| End Date | 2026-02-04 |
| High Point | 1.81042 (2025-08-20) |
| Low Point | 1.68356 (2026-02-04) |
| Fibonacci 0.236 | 1.71702 |
| Fibonacci 0.382 | 1.73812 |
| Fibonacci 0.5 | 1.74799 |
| Fibonacci 0.618 | 1.75786 |
| Fibonacci 0.786 | 1.77244 |
| Current Price | 1.68356 |
| Retracement Zone | None |
The current price is below all Fibonacci retracement levels, suggesting no significant pullback has occurred yet. Technically, this positions the EURAUD in a continued bearish momentum, with lower levels acting as potential support areas.
Conclusion
The EURAUD has been on a downward trajectory, reflecting possible economic disparities or monetary policy differences between the Eurozone and Australia. This trend, highlighted by the Fibonacci analysis, underscores key levels where price consolidations or reversals could occur. However, the current pricing being below retracement levels is indicative of persistent bearish sentiment, suggesting potential risk in jumping to bullish assumptions prematurely. Analysts are advised to remain cautious and consider broader economic indicators alongside technical factors when strategizing their positions in this currency pair.