November 14, 2025 a 05:08 am

EURAUD: Fibonacci Analysis
The EUR/AUD currency pair has experienced fluctuations over the past months, reflecting broader economic interactions between the Eurozone and Australia. Variations in economic data releases, central bank policies, and global market sentiment have played pivotal roles in shaping the currency trend. As a technical analyst, evaluating these trends through tools like Fibonacci retracement provides insights into potential future movements.
Fibonacci Analysis
| Detail | Value |
|---|---|
| Start Date | 2025-08-18 |
| End Date | 2025-11-14 |
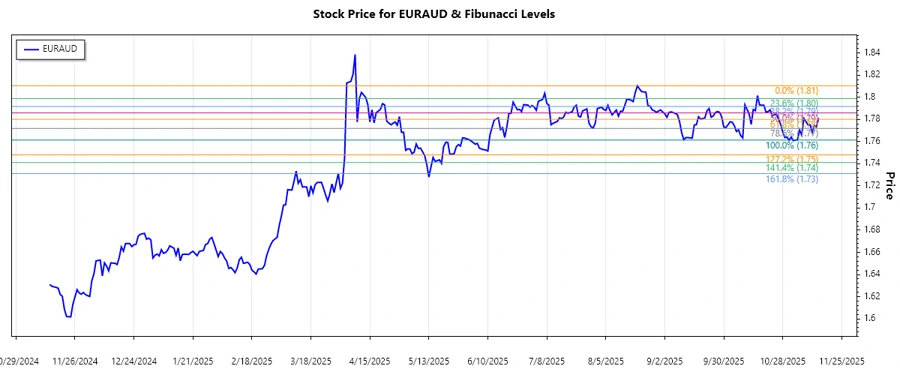
| High Price | 1.81042 on 2025-08-20 |
| Low Price | 1.76139 on 2025-11-03 |
| Fibonacci Level | Price Level |
|---|---|
| 0.236 | 1.77378 |
| 0.382 | 1.78254 |
| 0.5 | 1.78551 |
| 0.618 | 1.78849 |
| 0.786 | 1.79299 |
Currently, the price is near 1.78127, positioning it slightly below the 0.382 retracement level. This indicates a potential stabilizing support zone, suggesting the sellers might be losing momentum.
From a technical perspective, if the current price level holds near this retracement, it may act as a strong support, possibly leading to a bounce-back in the trend. Conversely, a continued drop might signal the emergence of a new downward push.
Conclusion
The EUR/AUD currency pair is at an interesting juncture, with the Fibonacci retracement levels indicating critical price zones that could serve as support or resistance. Analysts should watch the 0.382 level closely for signs of buyer strength. If resistance is encountered at the higher retracement levels, it could suggest selling opportunities. The ongoing economic conditions and potential rate changes from central banks could further influence these technical cues, emphasizing the importance of staying informed on both technical and fundamental levels.
Smart Data Insight
Master the Perfect Entry & Exit for this Stock
Don't leave your profits to chance. Historically, this stock follows specific seasonal patterns that institutional traders use to maximize returns.
- ✅ Identify the "Golden Buying Window"
- ✅ Avoid high-risk correction cycles
- ✅ Backtested data from the last 20+ years