October 09, 2025 a 05:08 am

EURAUD: Fibonacci Analysis
The EURAUD currency pair has been showcasing a volatile market pattern over recent months. Traders have been keenly observing the levels as the currency navigates through cyclical trends influenced by diverse eurozone and Australian economic developments. Understanding these patterns helps in forecasting potential price levels. It is crucial for analysts to study both fundamental and technical data to map out future movements.
Fibonacci Analysis
The analysis period reflected a dominant downtrend for EURAUD, characterized by specific high and low points, crucial for the Fibonacci retracement calculation.
| Detail | Information |
|---|---|
| Trend Start Date | 2025-08-21 |
| Trend End Date | 2025-10-09 |
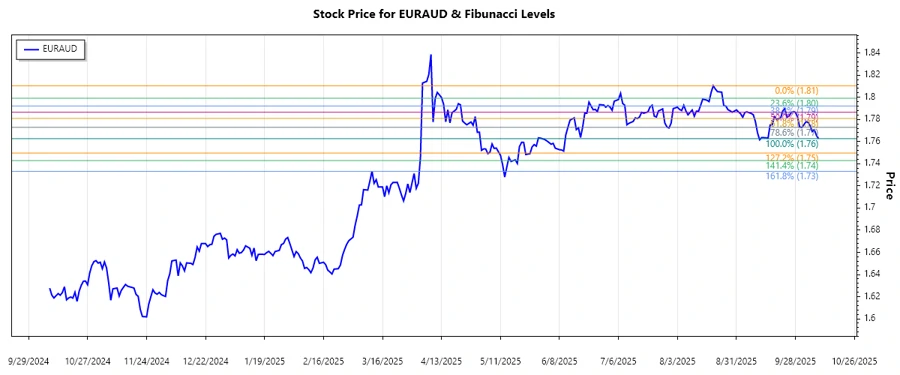
| High Price | 1.81042 (2025-08-20) |
| Low Price | 1.76266 (2025-10-09) |
| Fibonacci Level | Price Level |
|---|---|
| 0.236 | 1.77351 |
| 0.382 | 1.78022 |
| 0.5 | 1.78654 |
| 0.618 | 1.79286 |
| 0.786 | 1.80106 |
The current price of EURAUD is trading near the 0.236 retracement zone, suggesting potential for a resistive comeback or continued downtrend should the trend continue strongly.
Technical interpretation indicates key resistance at the 0.236 level, with a breakdown alerting further downward pressure.
Conclusion
The EURAUD's current movement near the 0.236 Fibonacci retracement level depicts its uncertainty to either continue its recovery or exhibit further bearish momentum. Investors are advised to watch upcoming macroeconomic developments that could affect the pair. A breakthrough above the significant Fibonacci levels could mean progressive recovery potential, while failure to hold current levels could relay a deeper descending trend. Thorough technical scrutiny and sound risk management should remain a focus for traders engaged in EURAUD positions.
Smart Data Insight
Master the Perfect Entry & Exit for this Stock
Don't leave your profits to chance. Historically, this stock follows specific seasonal patterns that institutional traders use to maximize returns.
- ✅ Identify the "Golden Buying Window"
- ✅ Avoid high-risk correction cycles
- ✅ Backtested data from the last 20+ years