
August 23, 2025 a 05:08 am
EURAUD: Fibonacci Analysis
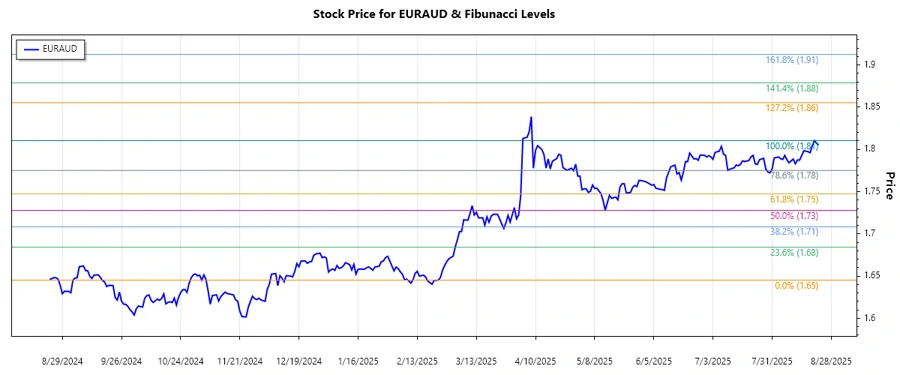
The EURAUD currency pair has shown an overall bullish trend recently. This has been driven by economic indicators favoring the Euro compared to the Australian Dollar. Traders should remain cautious of global economic shifts which may influence the current market dynamics.
Fibonacci Analysis
| Parameter | Details | ||||||||||||
|---|---|---|---|---|---|---|---|---|---|---|---|---|---|
| Trend Start Date | 2025-02-23 | ||||||||||||
| Trend End Date | 2025-08-20 | ||||||||||||
| High Price | 1.81042 on 2025-08-20 | ||||||||||||
| Low Price | 1.64524 on 2025-02-23 | ||||||||||||
|
|||||||||||||
| Current Price Position | The current price is in the 0.786 retracement zone. | ||||||||||||
| Technical Interpretation | The 0.786 level acts as a significant resistance. If the price breaks above, we may see a continuation of the bullish trend. | ||||||||||||
Conclusion
The analysis of the EURAUD shows a bullish uptrend reinforced by the current economic environment. Investors should watch the 0.786 Fibonacci level as a potential resistance. If broken, it could indicate further upward movement. However, economic uncertainties, such as changes in the central bank's policies, could impact this outlook. Considering both opportunities and risks, traders should maintain a balanced approach in their portfolios.
Smart Data Insight
Master the Perfect Entry & Exit for this Stock
Don't leave your profits to chance. Historically, this stock follows specific seasonal patterns that institutional traders use to maximize returns.
- ✅ Identify the "Golden Buying Window"
- ✅ Avoid high-risk correction cycles
- ✅ Backtested data from the last 20+ years