September 23, 2025 a 04:03 am**ETR: Trend and Support & Resistance Analysis - Entergy Corporation**
Entergy Corporation, with its strong presence in the electricity generation and retail distribution sectors, shows consistent performance, reflecting its strategic operations in the Utility and Wholesale Commodities segments. Its notable capacity in nuclear and gas power generation positions it well to meet diverse energy demands. Recent technical analysis indicates a cautious approach due to fluctuating trends and key support & resistance levels playing a crucial role in its near-term movement. Investors should monitor industry developments closely as they may significantly impact ETR's market performance.
Trend Analysis
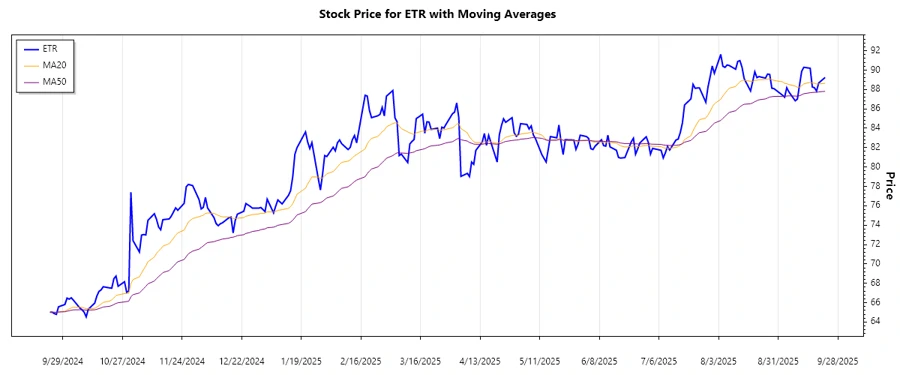
The analysis of Entergy Corporation's stock over the last several months reveals varying trends. For the latest comparison of EMA20 and EMA50:
Calculated EMA20: 88.36 | Calculated EMA50: 86.48
Trend Interpretation: With EMA20 slightly above EMA50, the current trend leans towards a ▲ Moderate Uptrend.
| Date | Closing Price ($) | Trend |
|---|---|---|
| 2025-09-22 | 89.24 | ▲ |
| 2025-09-19 | 88.67 | ▲ |
| 2025-09-18 | 87.83 | ▲ |
| 2025-09-17 | 88.18 | ▲ |
| 2025-09-16 | 88.26 | ▲ |
| 2025-09-15 | 90.19 | ▲ |
| 2025-09-12 | 90.29 | ▲ |
In conclusion, the stock exhibits a moderate uptrend with its current EMA positioning, suggesting a potential for growth in the short term, provided external market conditions remain favorable.
Support- and Resistance
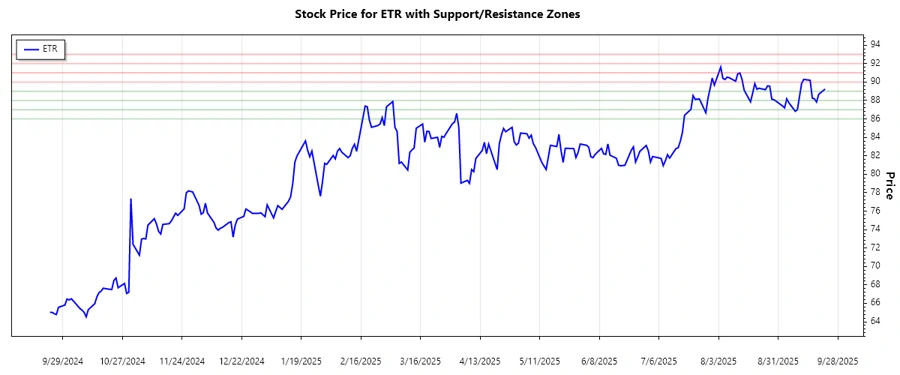
Upon analyzing recent closing prices, we determine two zones of support and resistance essential for traders:
Support Zones Calculated: $86.00 - $87.00 | $88.00 - $89.00
Resistance Zones Calculated: $90.00 - $91.00 | $92.00 - $93.00
| Zone Type | From ($) | To ($) |
|---|---|---|
| Support | 86.00 | 87.00 |
| Support | 88.00 | 89.00 |
| Resistance | 90.00 | 91.00 |
| Resistance | 92.00 | 93.00 |
The current price of $89.24 is on the brink of breaking through the nearest resistance zone, indicating potential bullish momentum should the resistance be surpassed. Traders should watch for any breakout signals in this zone.
Conclusion
Entergy Corporation's recent price movements suggest a moderately positive outlook as the EMA20 surpasses EMA50 slightly, indicating potential bullish developments. The existing support levels provide a safety margin against declines, while resistance levels mark critical points for further gains. Industry resilience and external economic factors will play a vital role in sustaining these trends. Although the stock shows promise, heightened vigilance is needed for potential industry shifts that could affect performance significantly.
Smart Data Insight
Master the Perfect Entry & Exit for this Stock
Don't leave your profits to chance. Historically, this stock follows specific seasonal patterns that institutional traders use to maximize returns.
- ✅ Identify the "Golden Buying Window"
- ✅ Avoid high-risk correction cycles
- ✅ Backtested data from the last 20+ years