
July 07, 2026 a 11:44 am
ETR: Fibonacci Analysis - Entergy Corporation
Entergy Corporation (ETR) has shown significant growth over the analyzed period, predominantly driven by its diversified energy portfolio, including substantial nuclear segment operations. The company has consistently expanded, evident from its distribution and commodity divisions catering to millions of customers. However, current market conditions and energy sector volatility must be considered in assessing its stock potential. Analyzing recent trends and retracement levels may yield insights into potential price movements and investment opportunities.
Fibonacci Analysis
| Attribute | Value |
|---|---|
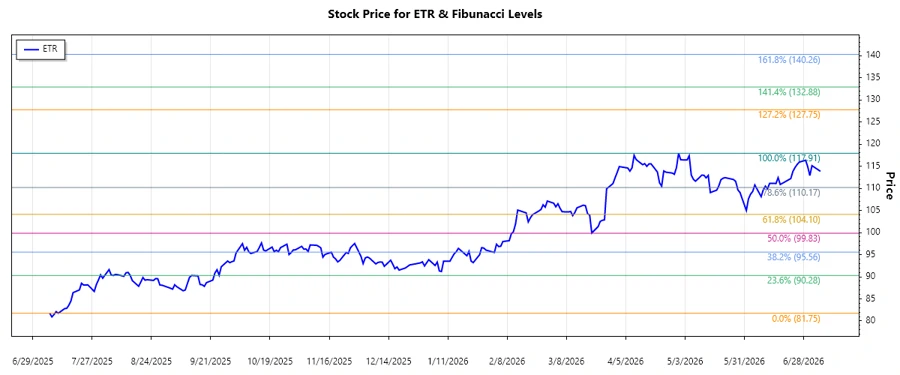
| Trend Start Date | 2026-01-08 |
| Trend End Date | 2026-07-06 |
| High Price | $117.91 (2026-04-30) |
| Low Price | $81.75 (2025-07-11) |
| Fibonacci 23.6% | $90.56 |
| Fibonacci 38.2% | $95.04 |
| Fibonacci 50.0% | $99.83 |
| Fibonacci 61.8% | $104.62 |
| Fibonacci 78.6% | $111.28 |
| Current Price | $113.83 |
| Retracement Zone | None (Currently above 78.6% level) |
| Interpretation | The stock is trading above key Fibonacci levels, suggesting a potential continuation of the bullish trend. If the price breaks above previous highs, it could signal further upward momentum. |
Conclusion
The Fibonacci analysis of Entergy Corporation's stock price shows a strong bullish trend, with the current price surpassing major retracement levels. The company's diversified energy approach and robust production capabilities place it in a good position amidst industry volatility. Potential investors should watch for any breakouts above past resistance levels that could imply further growth. However, risks such as energy market fluctuation and regulatory changes could impact future performance. Analysts should consider both technical and fundamental aspects when forecasting future price movements.
Smart Data Insight
Master the Perfect Entry & Exit for this Stock
Don't leave your profits to chance. Historically, this stock follows specific seasonal patterns that institutional traders use to maximize returns.
- ✅ Identify the "Golden Buying Window"
- ✅ Avoid high-risk correction cycles
- ✅ Backtested data from the last 20+ years