November 22, 2025 a 06:44 am
ETR: Fibonacci Analysis - Entergy Corporation
Entergy Corporation's stock has experienced significant fluctuations over the past months. As a major electricity provider, its stock performance is influenced by both regulatory changes and shifts in energy demand. Following historical trends can provide potential insights into future pricing actions. This analysis will focus on identifying key Fibonacci retracement levels based on recent trends to better understand potential future supports and resistances.
Fibonacci Analysis
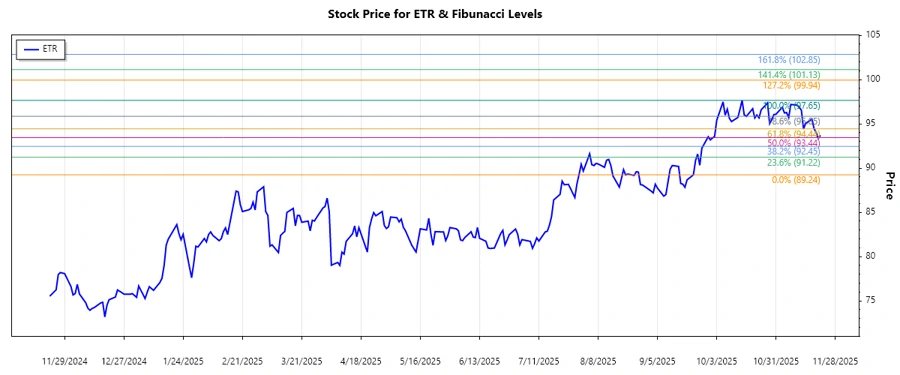
By analyzing Entergy Corporation's historical price data, a recent upward trend has been identified starting from mid-September 2025, reaching a peak in mid-November 2025. This trend serves as the basis for the Fibonacci retracement analysis.
| Trend Start Date | Trend End Date | High Price (Date) | Low Price (Date) |
|---|---|---|---|
| 2025-09-22 | 2025-11-17 | $97.65 (2025-10-15) | $89.24 (2025-09-22) |
| Fibonacci Level | Price Level |
|---|---|
| 0.236 | $95.85 |
| 0.382 | $94.41 |
| 0.5 | $93.445 |
| 0.618 | $92.48 |
| 0.786 | $91.30 |
The current price of the stock as of November 21, 2025 is $93.7. This places it in the vicinity of the 0.5 Fibonacci retracement level, suggesting a potential consolidation at this support level. A close monitoring is advised to assess potential breakout or breakdown.
Conclusion
The upward trend observed in Entergy Corporation's stock provides analysts with key zones of interest, where the stock may experience support or resistance based on Fibonacci retracement levels. While the stock hovers near a critical 0.5 retracement level, a decisive movement past this point could indicate a continuation of the trend or a reversal back to lower support levels. Investors should be cautious of external market factors that could affect the energy sector, such as regulatory changes or shifts in energy demand. Overall, the stock shows positive momentum, but vigilance is required to navigate the potential volatility.
Smart Data Insight
Master the Perfect Entry & Exit for this Stock
Don't leave your profits to chance. Historically, this stock follows specific seasonal patterns that institutional traders use to maximize returns.
- ✅ Identify the "Golden Buying Window"
- ✅ Avoid high-risk correction cycles
- ✅ Backtested data from the last 20+ years