
June 17, 2026 a 03:31 am

ETR: Dividend Analysis - Entergy Corporation
Entergy Corporation (NYSE: ETR) is a prominent player in the utilities sector known for its consistent dividend payments. With a stable dividend history spanning over three decades, it presents a reliable income source for investors. However, attention should be given to its payout ratios and growth potential, which suggest moderate growth within a competitive industry.
📊 Overview
Entergy Corporation, operating in the Utilities sector, offers an attractive dividend yield of 2.16% with a current dividend per share of 2.47 USD. The company boasts a substantial dividend history of 33 years, having never reduced or suspended its dividends during this period. Such consistency is appealing to income-focused investors.
| Description | Value |
|---|---|
| Sector | Utilities |
| Dividend yield | 2.16% |
| Current dividend per share | 2.47 USD |
| Dividend history | 33 years |
| Last cut or suspension | None |
📈 Dividend History
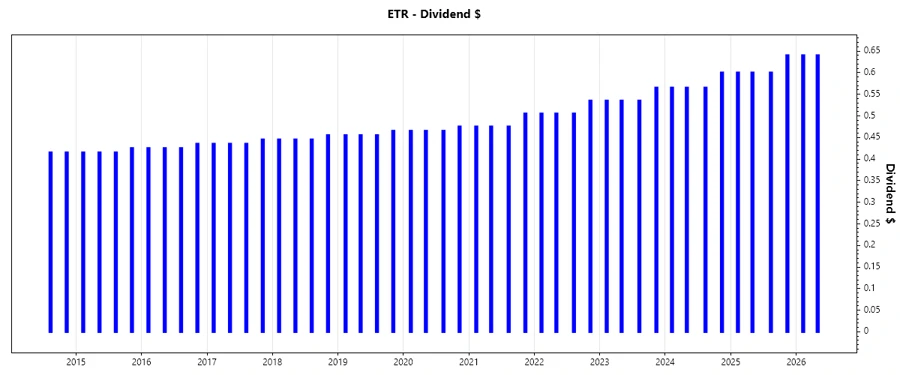
An extensive dividend history reflects Entergy's commitment to shareholders, offering a steady income stream and reinforcing confidence in its financial health. The absence of any cut or suspension over the years emphasizes its robust cash flow management.
| Year | Dividend Per Share (USD) |
|---|---|
| 2026 | 1.28 |
| 2025 | 2.44 |
| 2024 | 2.295 |
| 2023 | 2.17 |
| 2022 | 2.05 |
📉 Dividend Growth
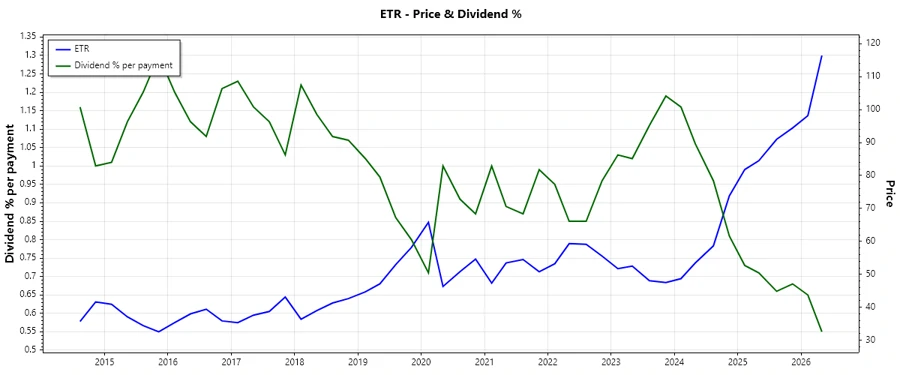
Understanding dividend growth is crucial for assessing future income potential. Entergy's dividend growth over the last 3 years is 5.98%, compared to 5.47% over 5 years. This consistent growth highlights the company's ability to enhance shareholder value over time.
| Time | Growth |
|---|---|
| 3 years | 5.98% |
| 5 years | 5.47% |
The average dividend growth is 5.47% over 5 years. This shows moderate but steady dividend growth, signifying a strong commitment to returning value to shareholders.
✅ Payout Ratio
The payout ratio is a key indicator of dividend sustainability. Entergy's EPS-based payout ratio stands at 62.51%, which is within a sustainable range for utilities, while the FCF-based payout ratio is negative, highlighting challenges in generating free cash flow.
| Key figure | Ratio |
|---|---|
| EPS-based | 62.51% |
| Free cash flow-based | -37.72% |
The EPS payout ratio suggests dividends are sustainable, but negative FCF requires close monitoring to ensure long-term viability without compromising growth.
💸 Cashflow & Capital Efficiency
Effective capital management and cash flow sustainability are critical for ongoing dividend payments. The company shows a concerning negative free cash flow yield and a high CAPEX to operating cash flow ratio, indicating capital-intensive operations.
| Year | 2023 | 2024 | 2025 |
|---|---|---|---|
| Free Cash Flow Yield | -1.95% | -4.57% | -6.83% |
| Earnings Yield | 11.03% | 3.27% | 4.34% |
| CAPEX to Operating Cash Flow | 109.72% | 132.99% | 154.18% |
| Stock-based Compensation to Revenue | 0% | 0% | 0% |
| Free Cash Flow / Operating Cash Flow Ratio | -9.72% | -32.99% | -54.18% |
While earnings yield remains strong, Entergy's negative free cash flow ratios depict challenges in liquidity, which could impact dividend payments if not managed appropriately.
📋 Balance Sheet & Leverage Analysis
A robust balance sheet ensures that dividends are sustainable and not overly reliant on leverage. Entergy's high debt-to-equity and debt-to-capital ratios suggest a leveraged balance sheet, but with adequate interest coverage and solvency ratios.
| Year | 2023 | 2024 | 2025 |
|---|---|---|---|
| Debt-to-Equity | 1.78 | 1.92 | 1.80 |
| Debt-to-Assets | 44.46% | 45.24% | 43.03% |
| Debt-to-Capital | 64.14% | 65.70% | 64.34% |
| Net Debt to EBITDA | 5.36 | 5.65 | 5.03 |
| Current Ratio | 0.52 | 0.70 | 0.73 |
| Quick Ratio | 0.27 | 0.41 | 0.50 |
| Financial Leverage | 4.02 | 4.23 | 4.19 |
With its current financial leverage, Entergy must focus on reducing debt levels to maintain financial stability and support its dividend policies effectively.
💡 Fundamental Strength & Profitability
Profitability ratios are vital in assessing firm competitiveness and sustainable growth. Entergy has shown a solid return on equity and acceptable margins across various categories.
| Year | 2023 | 2024 | 2025 |
|---|---|---|---|
| Return on Equity | 15.92% | 6.93% | 10.34% |
| Return on Assets | 3.96% | 1.64% | 2.47% |
| Net Margin | 19.45% | 8.93% | 13.70% |
| EBIT Margin | 22.05% | 21.83% | 27.87% |
| EBITDA Margin | 40.52% | 42.40% | 47.46% |
| Gross Margin | 43.87% | 48.30% | 29.91% |
| Research & Development to Revenue | 0% | 0% | 0% |
Despite positive profitability metrics, Entergy's growth in margins could be enhanced through strategic investments, potentially improving shareholder returns.
📈 Price Development
🗣️ Dividend Scoring System
| Criteria | Score | Score Bar |
|---|---|---|
| Dividend Yield | 3 | |
| Dividend Stability | 5 | |
| Dividend Growth | 4 | |
| Payout Ratio | 3 | |
| Financial Stability | 3 | |
| Dividend Continuity | 5 | |
| Cashflow Coverage | 2 | |
| Balance Sheet Quality | 3 |
Total Score: 28/40
🔍 Rating
Entergy Corporation exhibits a commendable track record with its dividend policies, backed by a robust history and reliability. Despite some concerns around free cash flow and leverage, the company’s essential service offering and stable cash generation in the Utility sector provide a foundation for future dividend payments. Investors seeking moderate yield with steady growth may find ETR an attractive long-term holding.
Smart Data Insight
Master the Perfect Entry & Exit for this Stock
Don't leave your profits to chance. Historically, this stock follows specific seasonal patterns that institutional traders use to maximize returns.
- ✅ Identify the "Golden Buying Window"
- ✅ Avoid high-risk correction cycles
- ✅ Backtested data from the last 20+ years