June 15, 2026 a 12:46 pm

ETR: Dividend Analysis - Entergy Corporation
Entergy Corporation presents as a strong dividend player with a consistent history of dividend payments spanning 33 years. The sustainability of its dividends is indicated by a moderate payout ratio, though its negative free cash flow yield raises liquidity concerns. Despite these issues, the company has demonstrated steady dividend growth, making it a valuable consideration for income-focused investors.
📊 Overview
Entergy Corporation operates within the energy sector, showcasing a dividend yield of approximately 2.16%. The corporation has consistently paid dividends over the last 33 years without any cuts or suspensions, which underscores its commitment to shareholder returns.
| Metric | Value |
|---|---|
| Sector | Energy |
| Dividend Yield | 2.16% |
| Current Dividend per Share | 2.47 USD |
| Dividend History | 33 years |
| Last Cut or Suspension | None |
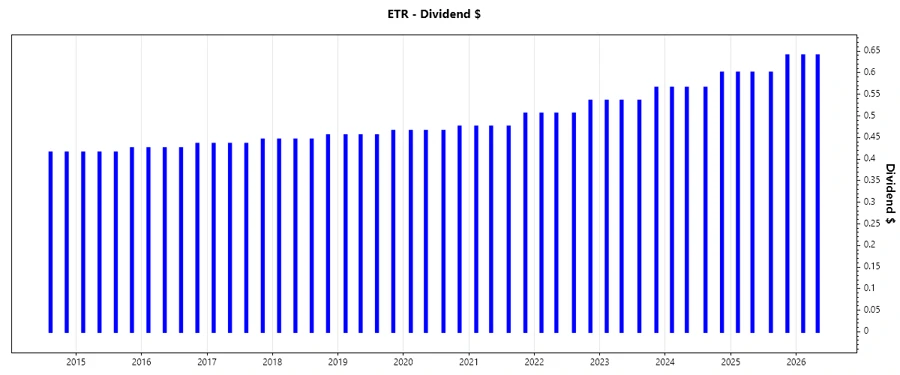
🗣️ Dividend History
Understanding the dividend history provides insight into the company’s reliability in maintaining steady payouts. Entergy Corporation’s ability to sustain dividends over the years is a positive indicator of its financial health.
| Year | Dividend per Share (USD) |
|---|---|
| 2026 | 1.28 |
| 2025 | 2.44 |
| 2024 | 2.295 |
| 2023 | 2.17 |
| 2022 | 2.05 |
📈 Dividend Growth
The growth trajectory of dividends reflects the company’s capacity to enhance shareholder value. Entergy Corporation has demonstrated a stable increase in its dividend payout, signaling strength and financial health.
| Time | Growth |
|---|---|
| 3 years | 5.98% |
| 5 years | 5.47% |
The average dividend growth is 5.47% over 5 years. This shows moderate but steady dividend growth.
✅ Payout Ratio
The payout ratio is crucial for assessing how much of the company’s earnings are distributed to shareholders as dividends. Entergy maintains a relatively high earnings-based payout ratio, indicative of a strong commitment to dividend payouts.
| Key Figure | Ratio |
|---|---|
| EPS-based | 62.51% |
| Free Cash Flow-based | -37.71% |
The payout ratio of 62.51% based on EPS is sustainable, although negative free cash flow might pressure future payments if it persists.
Cashflow & Capital Efficiency
Examining cashflow and capital efficiency highlights how well the company manages its resources and finances growth. Notably, the negative free cash flow ratio indicates potential liquidity challenges.
| Metric | 2023 | 2024 | 2025 |
|---|---|---|---|
| Free Cash Flow Yield | -5.90% | -4.57% | -6.83% |
| Earnings Yield | 3.56% | 3.27% | 4.34% |
| CAPEX to Operating Cash Flow | 155.12% | 132.99% | 154.18% |
| Stock-based Compensation to Revenue | -0.16% | 0.00% | 0.00% |
| Free Cash Flow / Operating Cash Flow Ratio | -54.18% | -32.99% | -54.18% |
The lack of free cash flow could signal future limits on dividend payments and capital reinvestment.
Balance Sheet & Leverage Analysis
A comprehensive view of leverage and liquidity is critical for understanding financial flexibility. Entergy’s higher-than-average leverage ratios could affect overall risk levels.
| Metric | 2023 | 2024 | 2025 |
|---|---|---|---|
| Debt-to-Equity | 180.46% | 191.53% | 180.46% |
| Debt-to-Assets | 43.03% | 45.24% | 43.03% |
| Debt-to-Capital | 64.34% | 65.70% | 64.34% |
| Net Debt to EBITDA | 5.16 | 5.65 | 5.03 |
| Current Ratio | 95.71% | 95.71% | 95.71% |
| Quick Ratio | 49.57% | 40.89% | 49.57% |
| Financial Leverage | 419.37% | 423.37% | 419.37% |
While the company’s leverage is high, its financial stability remains supported by consistent dividend payments.
Fundamental Strength & Profitability
Despite fluctuations, Entergy Corporation shows effective profitability metrics that reaffirm its strategic operations and potential long-term growth.
| Metric | 2023 | 2024 | 2025 |
|---|---|---|---|
| Return on Equity | 10.63% | 6.93% | 10.34% |
| Return on Assets | 2.38% | 1.64% | 2.47% |
| Net Margin | 19.45% | 8.93% | 13.70% |
| EBIT Margin | 22.05% | 21.83% | 27.87% |
| EBITDA Margin | 40.52% | 42.40% | 47.46% |
The robust profitability ratios indicate long-term growth prospects, supported by high ROE and stable margins.
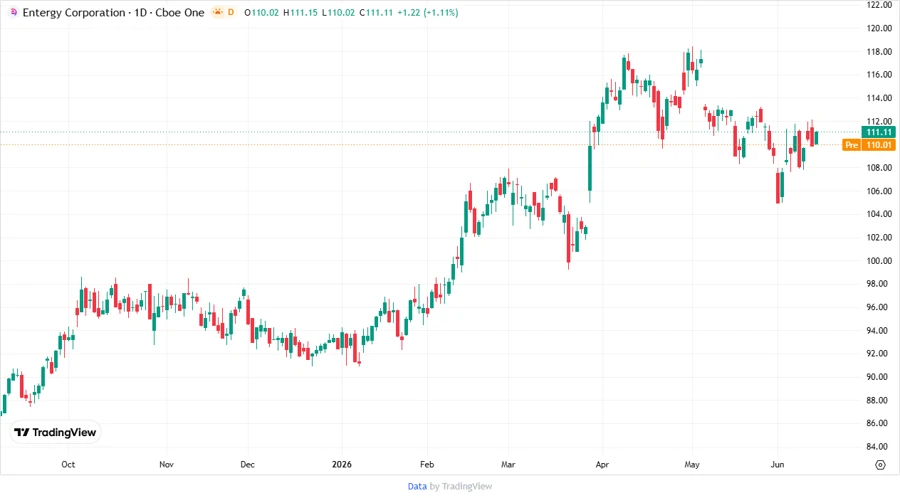
Price Development
Dividend Scoring System
| Category | Score | Score Indicator |
|---|---|---|
| Dividend Yield | 3 | |
| Dividend Stability | 5 | |
| Dividend Growth | 4 | |
| Payout Ratio | 4 | |
| Financial Stability | 3 | |
| Dividend Continuity | 5 | |
| Cashflow Coverage | 2 | |
| Balance Sheet Quality | 3 |
Total Score: 29/40
Rating
Entergy Corporation is rated as a reliable dividend stock with some financial challenges that could impact future yield stability. Given its strong history, stable growth, and dividend continuity, it remains a suitable option for risk-balanced portfolios.
Smart Data Insight
Master the Perfect Entry & Exit for this Stock
Don't leave your profits to chance. Historically, this stock follows specific seasonal patterns that institutional traders use to maximize returns.
- ✅ Identify the "Golden Buying Window"
- ✅ Avoid high-risk correction cycles
- ✅ Backtested data from the last 20+ years