May 23, 2026 a 07:46 am
ETR: Dividend Analysis - Entergy Corporation
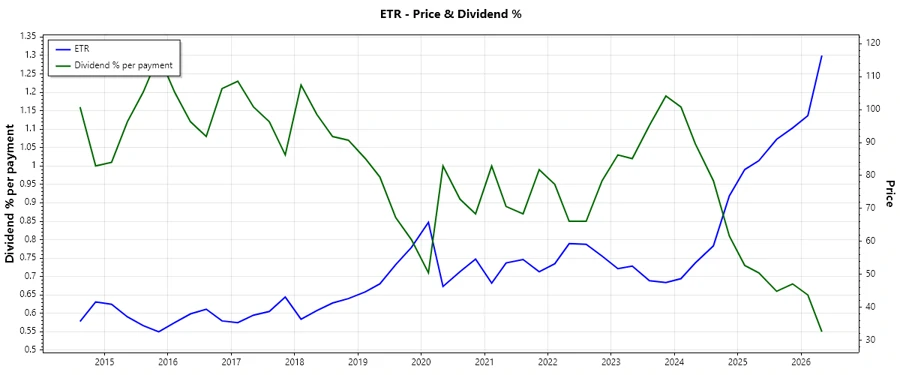
Entergy Corporation offers investors a compelling dividend profile, with a stable dividend history of 33 years and a dividend yield of approximately 2.16%. Despite a historically strong dividend growth rate over the past five years, payout ratios should be carefully monitored given recent financial metrics. Investors seeking steady income with potential for incremental growth might find Entergy’s dividends attractive, though significant attention should be paid to underlying financial health and leverage.
📊 Overview
Entergy Corporation, operating in the Utilities sector, presents a dividend yield of 2.16%, with a current dividend per share of 2.47 USD. With a rich history of 33 years of continuous dividends and no recent dividend cuts or suspensions, Entergy illustrates stability and reliability to income-focused investors.
| Metric | Value |
|---|---|
| Sector | Utilities |
| Dividend yield | 2.16 % |
| Current dividend per share | 2.47 USD |
| Dividend history | 33 years |
| Last cut or suspension | None |
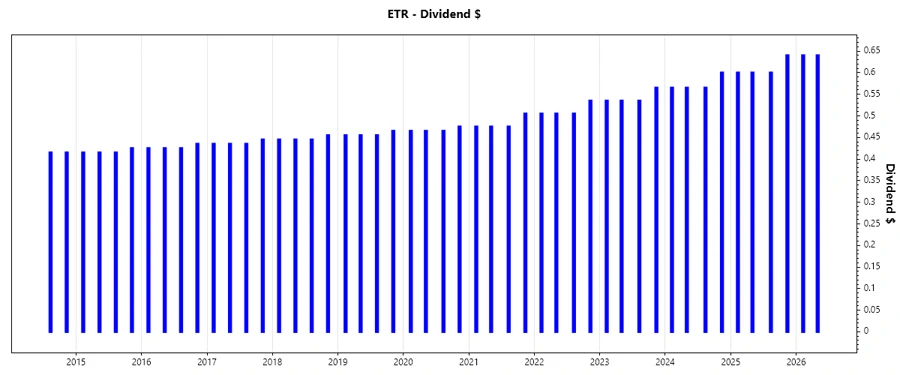
🗣️ Dividend History
With a consistent dividend payment history spanning over three decades, Entergy Corporation has demonstrated resilience and a commitment to returning value to shareholders. Such a record is indicative of a robust business model and prudent fiscal management, which are crucial for sustaining longer-term financial stability and investor confidence.
| Year | Dividend Per Share (USD) |
|---|---|
| 2026 | 1.28 |
| 2025 | 2.44 |
| 2024 | 2.295 |
| 2023 | 2.170 |
| 2022 | 2.050 |
📈 Dividend Growth
Analyzing the dividend growth rates over 3 and 5 years reveals Entergy's modest but steady growth trajectory. This growth is vital for investors seeking an increasing income stream above inflation, which protects and enhances purchasing power over time.
| Time | Growth |
|---|---|
| 3 years | 5.98 % |
| 5 years | 5.47 % |
The average dividend growth is 5.47% over 5 years. This shows moderate but steady dividend growth.
💹 Payout Ratio
The payout ratios based on EPS and FCF provide insight into the sustainability of Entergy's dividend. With an EPS-based payout ratio of 62.51%, the dividend appears sustainable given the company's earnings. However, the FCF-based payout ratio is notably negative, which warrants close scrutiny regarding cash flow adequacy or potential operational challenges.
| Key figure | Ratio |
|---|---|
| EPS-based | 62.51 % |
| Free cash flow-based | -37.71 % |
The EPS-based payout is reasonable, reflecting good earnings coverage of dividends. The negative FCF ratio requires attention, suggesting potential liquidity issues.
💰 Cashflow & Capital Efficiency
Evaluating cash flow and capital efficiency highlights key aspects of Entergy’s financial health. These metrics reveal how effectively the company converts revenue into cash flow and allocates capital, critical for sustaining dividend payments.
| Year | 2023 | 2024 | 2025 |
|---|---|---|---|
| Free Cash Flow Yield | -1.95 % | -4.57 % | -6.83 % |
| Earnings Yield | 11.03 % | 3.27 % | 4.34 % |
| CAPEX to Operating Cash Flow | 109.71 % | 132.99 % | 154.18 % |
| Stock-based Compensation to Revenue | 0 % | 0 % | 0 % |
| Free Cash Flow / Operating Cash Flow Ratio | -9.71 % | -32.99 % | -54.18 % |
The negative free cash flow yield and high CAPEX relative to operating cash flow suggest potential challenges in liquidity, affecting capital efficiency, and thus dividend sustainability.
🗒️ Balance Sheet & Leverage Analysis
Analyzing balance sheet metrics provides insights into Entergy's debt structure and overall financial stability. Higher leverage ratios may imply increased risk amidst debt management.
| Year | 2023 | 2024 | 2025 |
|---|---|---|---|
| Debt-to-Equity | 178.83 % | 191.53 % | 180.46 % |
| Debt-to-Assets | 44.46 % | 45.24 % | 43.03 % |
| Debt-to-Capital | 64.14 % | 65.70 % | 64.34 % |
| Net Debt to EBITDA | 5.36 | 5.64 | 5.03 |
| Current Ratio | 0.52 | 0.70 | 0.73 |
| Quick Ratio | 0.27 | 0.41 | 0.50 |
| Financial Leverage | 4.02 | 4.23 | 4.19 |
The high debt-to-equity and net debt-to-EBITDA ratios indicate Entergy's leveraged position, impacting financial flexibility. Stability in terms of liquidity needs improvement as reflected by current and quick ratios.
🧮 Fundamental Strength & Profitability
Key profitability and fundamental ratios, including ROE and profit margins, gauge Entergy's ability to generate earnings relative to shareholder's equity and other resources.
| Year | 2023 | 2024 | 2025 |
|---|---|---|---|
| Return on Equity | 15.92 % | 6.93 % | 10.34 % |
| Return on Assets | 3.96 % | 1.64 % | 2.47 % |
| Net Margin | 19.44 % | 8.93 % | 13.70 % |
| EBIT Margin | 22.05 % | 21.83 % | 27.87 % |
| EBITDA Margin | 40.52 % | 42.40 % | 47.46 % |
| Gross Margin | 43.87 % | 48.30 % | 29.91 % |
Entergy's highly variable ROE and margins underscore the headline risk factors. Consistent profitability growth requires strategic improvements in operation and expense management.
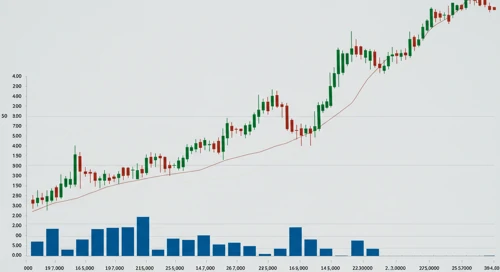
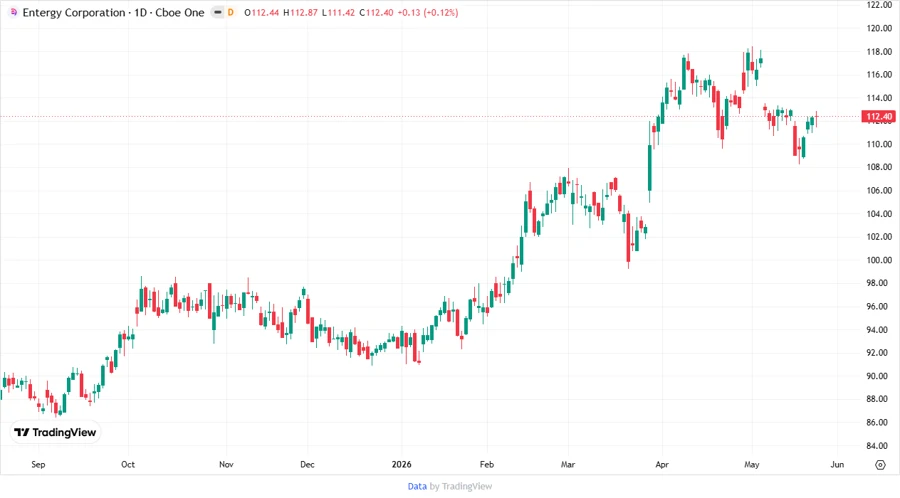
📉 Price Development
📊 Dividend Scoring System
| Category | Score | |
|---|---|---|
| Dividend yield | 4 | |
| Dividend Stability | 5 | |
| Dividend growth | 3 | |
| Payout ratio | 2 | |
| Financial stability | 2 | |
| Dividend continuity | 5 | |
| Cashflow Coverage | 1 | |
| Balance Sheet Quality | 3 |
Total Score: 25/40
✅ Rating
Entergy Corporation exhibits robust dividend stability and continuity, supported by a favorable yield. However, challenges in cash flow coverage and financial leverage suggest heightened risk. Prospective investors may consider this offering suitable for a risk-adjusted portfolio, emphasizing regular income but recognizing potential capital allocation challenges. Continued vigilance on financial dynamics is recommended to secure sustained dividend health.
Smart Data Insight
Master the Perfect Entry & Exit for this Stock
Don't leave your profits to chance. Historically, this stock follows specific seasonal patterns that institutional traders use to maximize returns.
- ✅ Identify the "Golden Buying Window"
- ✅ Avoid high-risk correction cycles
- ✅ Backtested data from the last 20+ years