
May 04, 2026 a 07:31 am
ETR: Dividend Analysis - Entergy Corporation
Entergy Corporation, a key player in the utilities sector, presents a considerable investment opportunity with its moderate dividend yield and consistent history of dividend payouts. Despite a negative free cash flow yield, the company's robust dividend history of 33 years without cuts underscores its commitment to returning value to shareholders. The payout ratios based on EPS and free cash flow indicate relative sustainability, albeit with room for careful monitoring.
📊 Overview
Entergy Corporation operates within the utilities sector, offering a stable dividend yield of 2.16%. This yield is based on a current dividend per share of 2.47 USD, with an impressive streak of 33 years of dividend history without cuts or suspensions. Such a robust track record positions Entergy as a reliable dividend-focused investment.
| Metric | Value |
|---|---|
| Sector | Utilities |
| Dividend Yield | 2.16% |
| Current Dividend per Share | 2.47 USD |
| Dividend History | 33 years |
| Last Cut or Suspension | None |
🗣️ Dividend History
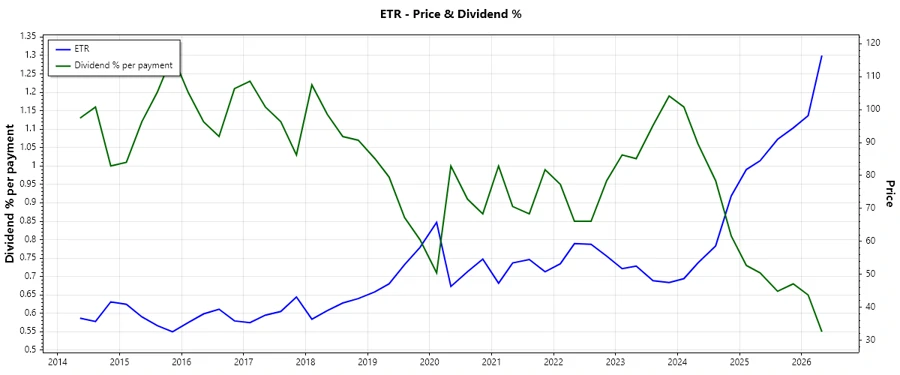
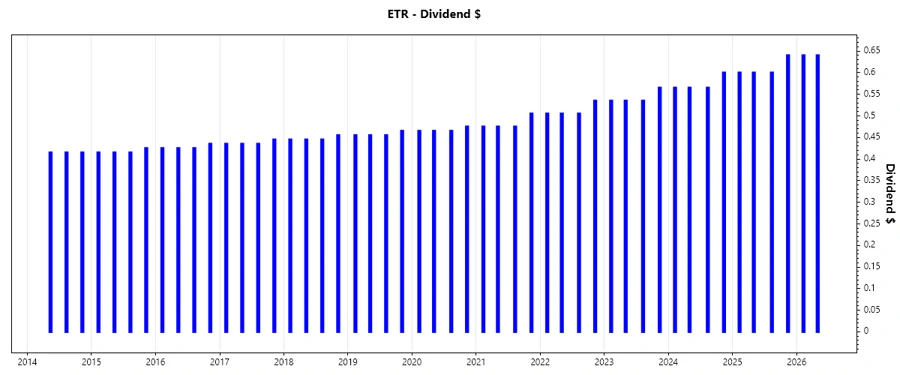
Consistency in dividend payments is critical for income investors. Entergy's long-standing dividend history, without interruptions, highlights their strong cash flow management and shareholder return orientation. Below is a snapshot of the latest 5 dividend payments, illustrating a stable and increasing trend.
| Year | Dividend per Share (USD) |
|---|---|
| 2026 | 1.28 |
| 2025 | 2.44 |
| 2024 | 2.30 |
| 2023 | 2.17 |
| 2022 | 2.05 |
📈 Dividend Growth
Dividend growth is a positive indicator of a company's financial health and profitability. For Entergy, the dividend growth over the past 3 years was approximately 5.98%, and over 5 years, it was about 5.47%. This consistent growth emphasizes the company's focus on enhancing shareholder value through increased cash distributions.
| Time | Growth |
|---|---|
| 3 years | 5.98% |
| 5 years | 5.47% |
The average dividend growth is 5.47% over 5 years. This shows moderate but steady dividend growth.
⚠️ Payout Ratio
A sustainable payout ratio is essential to ensure future dividend stability. Entergy's payout ratio based on EPS is relatively healthy at 62.51%, indicating room for growth and stability, while the free cash flow-based payout ratio is negative. This highlights some concerns on cash flow management, requiring close monitoring.
| Key Figure | Ratio |
|---|---|
| EPS-based | 62.51% |
| Free cash flow-based | -37.71% |
With a 62.51% EPS-based payout ratio, Entergy shows a balanced approach, but the negative free cash flow-based ratio warrants attention to their cash outflows.
🤑 Cashflow & Capital Efficiency
Cash flow and capital efficiency are crucial indicators of a company's operational performance and financial health. Entergy's free cash flow yield is negative, reflecting challenges in cash generation relative to its size and operations. Investment management, particularly in CAPEX compared to operating cash flow, requires strategic oversight to ensure optimal returns.
| Metric | 2025 | 2024 | 2023 |
|---|---|---|---|
| Free Cash Flow Yield | -6.83% | -4.57% | -1.95% |
| Earnings Yield | 4.34% | 3.27% | 11.03% |
| CAPEX to Operating Cash Flow | 1.54 | 1.33 | 1.10 |
| Stock-based Compensation to Revenue | 0% | 0% | 0% |
| Free Cash Flow / Operating Cash Flow Ratio | -0.54 | -0.33 | -0.10 |
Despite the negatives in free cash flow yields, the consistent profit margins and CAPEX investments support potential long-term stability and efficiency improvements.
📉 Balance Sheet & Leverage Analysis
An analysis of Entergy's balance sheet reveals leverage concerns, with substantial ratios across various debt metrics. Attention should focus on debt management policies to maintain solvency and liquidity positions to safeguard against financial distress.
| Metric | 2025 | 2024 | 2023 |
|---|---|---|---|
| Debt-to-Equity | 1.80 | 1.92 | 1.79 |
| Debt-to-Assets | 0.43 | 0.45 | 0.44 |
| Debt-to-Capital | 0.64 | 0.66 | 0.64 |
| Net Debt to EBITDA | 5.03 | 5.65 | 5.36 |
| Current Ratio | 0.00 | 0.70 | 0.52 |
| Quick Ratio | 0.50 | 0.41 | 0.27 |
| Financial Leverage | 4.19 | 4.23 | 4.02 |
While Entergy maintains substantial leverage rates, consistent interest coverage and solvency measures provide a degree of reassurance for stakeholders.
✅ Fundamental Strength & Profitability
Profitability metrics are essential to understand a company's ability to generate earnings. Entergy’s profitability ratios, although varied year-on-year, present a reliable indicator of operational efficiency and strategic financial management to support shareholder value.
| Metric | 2025 | 2024 | 2023 |
|---|---|---|---|
| Return on Equity | 10.34% | 6.93% | 15.92% |
| Return on Assets | 2.47% | 1.64% | 3.96% |
| Margins: Net | 13.70% | 8.93% | 19.45% |
| Margins: Gross | 29.91% | 48.30% | 43.87% |
| Research & Development to Revenue | 0% | 0% | 0% |
These metrics reflect significant profitability and strategic resource allocation, laying the groundwork for future growth prospects while ensuring efficient operations.
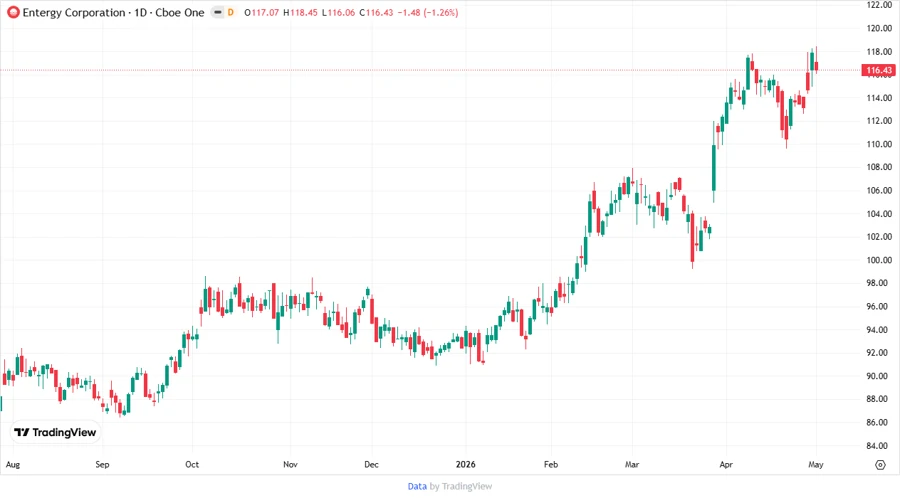
📉 Price Development
🎯 Dividend Scoring System
| Category | Score | Visual Score |
|---|---|---|
| Dividend Yield | 3 | |
| Dividend Stability | 5 | |
| Dividend Growth | 3 | |
| Payout Ratio | 3 | |
| Financial Stability | 4 | |
| Dividend Continuity | 5 | |
| Cashflow Coverage | 2 | |
| Balance Sheet Quality | 3 |
Total Score: 28/40
🔍 Rating
Entergy Corporation’s consistent dividend history, coupled with moderate growth and sustained payout ratios, positions it as a viable investment for income-focused portfolios. However, careful attention should be given to its leverage and free cash flow challenges. Overall, Entergy exhibits the characteristics of a stable utility player, but prospective investors should weigh its capital allocation tactics against broader market opportunities.
Smart Data Insight
Master the Perfect Entry & Exit for this Stock
Don't leave your profits to chance. Historically, this stock follows specific seasonal patterns that institutional traders use to maximize returns.
- ✅ Identify the "Golden Buying Window"
- ✅ Avoid high-risk correction cycles
- ✅ Backtested data from the last 20+ years