November 06, 2025 a 07:47 am
ETR: Dividend Analysis - Entergy Corporation
Entergy Corporation has exhibited a consistent dividend distribution over the past decades, boasting an attractive yield alongside a stable growth trajectory. Despite challenges, the firm has demonstrated resilience and a commitment to rewarding its shareholders. This analysis explores the detailed aspects of Entergy's dividend profile and its financial health.
📊 Overview
Entergy Corporation, a major player in the energy sector, offers investors a dividend yield of 2.53%, with a current dividend per share set at 2.34 USD. The company takes pride in its 32-year history of dividend payments, indicating strong dividend stability. Moreover, the last occasion of a dividend cut dates back to 1999, underlining sustained fiscal health.
| Metric | Value |
|---|---|
| Sector | Energy |
| Dividend Yield | 2.53% |
| Current Dividend per Share | 2.34 USD |
| Dividend History | 32 years |
| Last Cut or Suspension | 1999 |
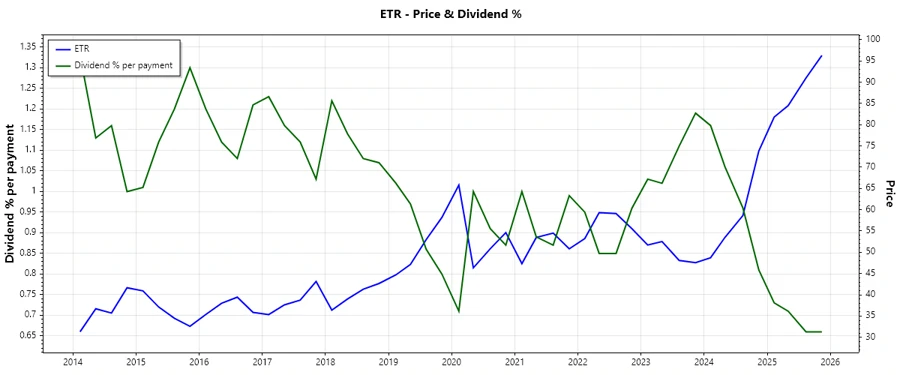
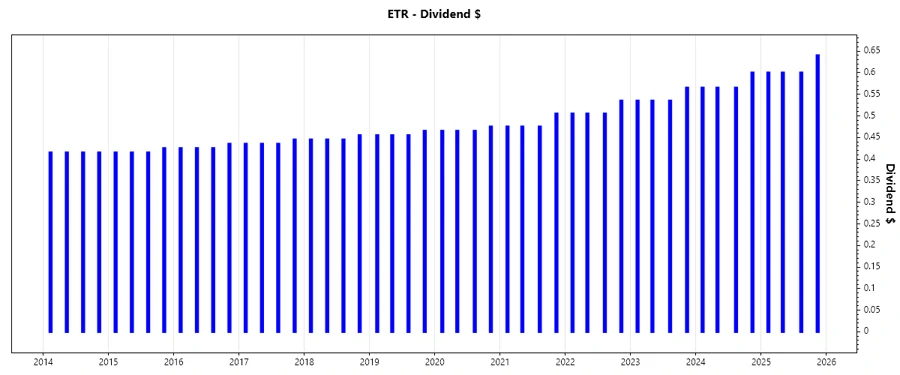
📈 Dividend History
The historical dividend performance of Entergy Corporation underscores its strong commitment to shareholders. With a consistent distribution record over the years, it is evident that the company prioritizes dividend reliability, a vital consideration for risk-averse investors.
| Year | Dividend per Share (USD) |
|---|---|
| 2025 | 2.44 |
| 2024 | 2.30 |
| 2023 | 2.17 |
| 2022 | 2.05 |
| 2021 | 1.93 |
📉 Dividend Growth
Understanding dividend growth is crucial as it signals the company’s financial health and its ability to increase shareholder returns over time. Entergy’s dividend growth over the past several years showcases moderate but reliable increases, reflective of its steady operational performance.
| Time | Growth |
|---|---|
| 3 years | 5.94% |
| 5 years | 4.63% |
The average dividend growth is 4.63% over 5 years. This shows moderate but steady dividend growth.
✅ Payout Ratio
The payout ratio is a critical indicator of the sustainability of a company's dividend payments. While Entergy maintains an EPS-based payout ratio of 56.49%, the free cash flow-based payout ratio is negative, reflecting the unique challenges faced in cash flow generation, which may affect future dividend stability.
| Key Figure | Ratio |
|---|---|
| EPS-based | 56.49% |
| Free Cash Flow-based | -44.92% |
While the EPS-based payout ratio of 56.49% suggests a sustainable dividend distribution, the negative FCF payout ratio invites cautious optimism concerning future payouts, contingent upon the company's ability to revert to positive cash flow generation.
📊 Cashflow & Capital Efficiency
Effective cash flow management and capital efficiency remain pivotal for sustaining high dividend payouts. For Entergy, significant reliance on CAPEX compared to operating cash flow indicates extensive reinvestment efforts, which may constrain near-term free cash flow.
| Year | 2024 | 2023 | 2022 |
|---|---|---|---|
| Free Cash Flow Yield | -4.57% | -1.95% | -11.75% |
| Earnings Yield | 3.27% | 11.03% | 4.77% |
| CAPEX to Operating Cash Flow | 132.99% | 109.72% | 204.55% |
| Stock-based Compensation to Revenue | 0% | 0% | 0.33% |
| Free Cash Flow / Operating Cash Flow Ratio | -32.99% | -9.72% | -104.55% |
| Return on Invested Capital | 3.20% | 6.54% | 3.84% |
The negative free cash flow yield underscores potential liquidity constraints, with extensive capital expenditure investments potentially dampening near-term cash flow stability. Such efforts align with a strategic growth vision but necessitate caution.
🔍 Balance Sheet & Leverage Analysis
Entergy's balance sheet reveals a reliance on leverage to fuel its growth ambitions, reflected in its debt metrics. Prudent management of leverage is essential to mitigate financial risks amidst volatile market conditions.
| Year | 2024 | 2023 | 2022 |
|---|---|---|---|
| Debt-to-Equity | 191.28% | 179.06% | 205.82% |
| Debt-to-Assets | 44.63% | 43.96% | 45.67% |
| Debt-to-Capital | 65.67% | 64.17% | 67.30% |
| Net Debt to EBITDA | 5.57 | 5.30 | 6.26 |
| Current Ratio | 0.71 | 0.57 | 0.64 |
| Quick Ratio | 0.43 | 0.32 | 0.43 |
| Financial Leverage | 4.29 | 4.07 | 4.51 |
Elevated leverage ratios dictate that Entergy must exercise judicious debt management to avert liquidity pressures and maintain financial solvency. Despite formidable leverage, the company has consistently met its short-term obligations.
📊 Fundamental Strength & Profitability
Profitability and fundamental strength are core to sustaining dividend returns. Entergy's diverse profit margins and returns indicate robust operational efficiency and highlight its competitive positioning within the energy sector.
| Year | 2024 | 2023 | 2022 |
|---|---|---|---|
| Return on Equity | 7.02% | 16.12% | 8.44% |
| Return on Assets | 1.64% | 3.96% | 1.87% |
| Net Profit Margin | 8.93% | 19.45% | 7.97% |
| EBIT Margin | 21.83% | 22.05% | 14.86% |
| EBITDA Margin | 42.40% | 40.52% | 30.78% |
| Gross Margin | 48.30% | 43.87% | 38.33% |
| Research & Development to Revenue | 0% | 0% | 0% |
Entergy's profitability metrics demonstrate resilient financial health, driven by strategic initiatives that leverage operational efficiencies. The company's diversified profit margins portend strength within a competitive landscape.
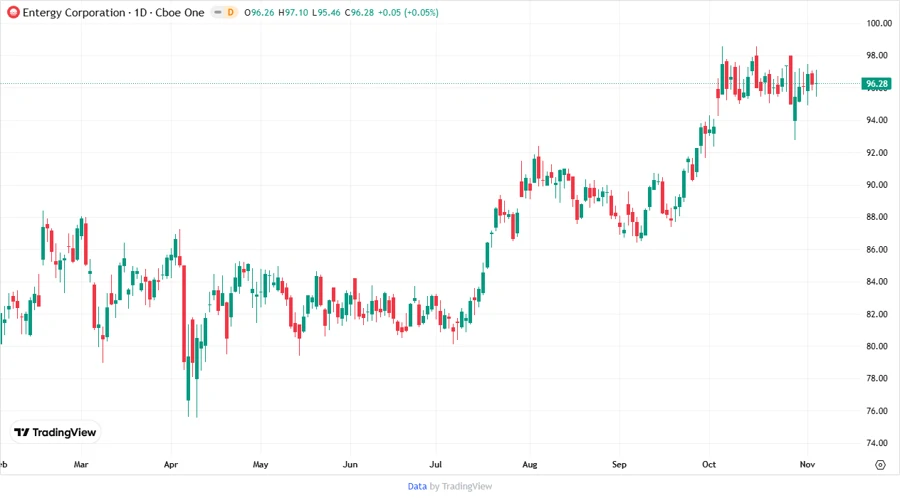
📊 Price Development
🔍 Dividend Scoring System
| Criterion | Score | |
|---|---|---|
| Dividend Yield | 3 | |
| Dividend Stability | 4 | |
| Dividend Growth | 3 | |
| Payout Ratio | 3 | |
| Financial Stability | 2 | |
| Dividend Continuity | 4 | |
| Cashflow Coverage | 2 | |
| Balance Sheet Quality | 3 |
Total Score: 24/40
🏆 Rating
Entergy Corporation demonstrates solid fundamentals, strong dividend stability, and moderate growth potential. With a total score of 24/40, the company exhibits a compelling investment narrative for dividend-focused investors, though cautious attention must be paid to leverage and cash flow considerations to ensure sustained returns. Overall, Entergy presents a credible option for investors seeking consistent income within the energy sector.
Smart Data Insight
Master the Perfect Entry & Exit for this Stock
Don't leave your profits to chance. Historically, this stock follows specific seasonal patterns that institutional traders use to maximize returns.
- ✅ Identify the "Golden Buying Window"
- ✅ Avoid high-risk correction cycles
- ✅ Backtested data from the last 20+ years