September 24, 2025 a 02:47 am

ETR: Dividend Analysis - Entergy Corporation
Entergy Corporation has been a consistent performer in the dividend space, showcasing a robust history of 32 years without interruptions. With a moderate yet steady growth of dividends, this company has established itself as a reliable player in the utility sector. The current dividend yield stands at 2.64%, paired with strong fundamentals and a focus on capital efficiency. However, the negative free cash flow yield is a point of concern. Despite this, Entergy's financial strength and strategic direction remain promising for dividend growth enthusiasts.
Overview 📊
The utility sector is renowned for its stable dividends, and Entergy Corporation is a testament to this philosophy. Here's a snapshot of its current dividend profile and sector specification:
| Metric | Data |
|---|---|
| Sector | Utilities |
| Dividend Yield | 2.64% |
| Current Dividend per Share | $2.34 USD |
| Dividend History | 32 years |
| Last Cut or Suspension | None |
Dividend History 📈
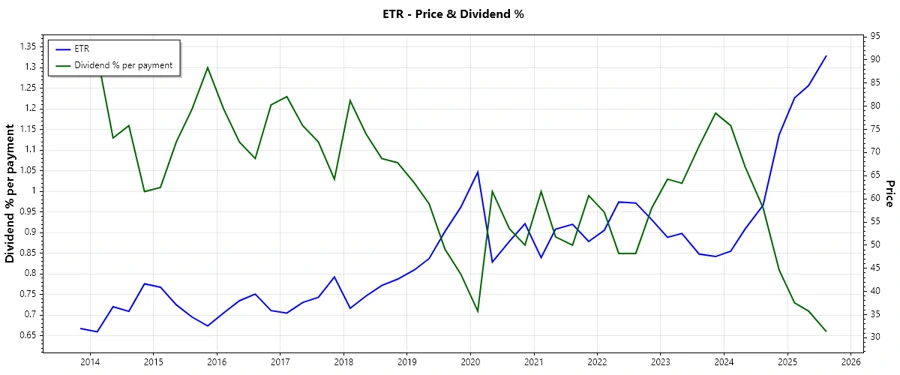
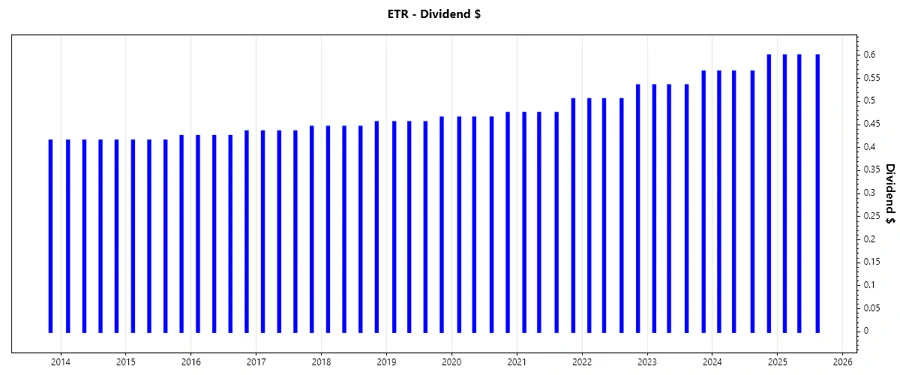
The company's 32-year streak of consistent dividend payments underscores its commitment to shareholders. Examining the dividend history reveals a gradual increase, indicative of stable growth. This consistency fosters investor confidence and long-term interest.
| Year | Dividend per Share (USD) |
|---|---|
| 2025 | 1.80 |
| 2024 | 2.295 |
| 2023 | 2.17 |
| 2022 | 2.05 |
| 2021 | 1.93 |
Dividend Growth 📊
Steady dividend growth is a hallmark of Entergy’s financial strategy. Over the last 3 years, dividends have grown by approximately 5.94%, and 4.63% over the last 5 years, indicating a stable upward trajectory that complements patient, value-focused investors.
| Time | Growth |
|---|---|
| 3 years | 5.94% |
| 5 years | 4.63% |
The average dividend growth is 4.63% over 5 years. This shows moderate but steady dividend growth.
Payout Ratio 🗣️
Payout ratios highlight dividend sustainability against earnings and free cash flow. A 58.18% EPS payout ratio is within a healthy range, ensuring earnings coverage.
| Key Figure | Ratio |
|---|---|
| EPS-based | 58.18% |
| Free cash flow-based | -41.31% |
While the EPS-based ratio is prudent, the negative FCF raises questions about funding sustainability through operations.
Cashflow & Capital Efficiency 📈
Capital efficiency and cashflow metrics provide insights into operational efficiency. Entergy's negative free cash flow yield suggests reinvestment or potential challenges in funding sustainability.
| Year | 2024 | 2023 | 2022 |
|---|---|---|---|
| Free Cash Flow Yield | -4.57% | -1.95% | -11.75% |
| Earnings Yield | 3.27% | 11.03% | 4.77% |
| CAPEX to Operating Cash Flow | 132.99% | 109.72% | 204.55% |
| Stock-based Compensation to Revenue | 0% | 0% | 0.33% |
| Free Cash Flow / Operating Cash Flow Ratio | -32.99% | -9.72% | -104.55% |
Entergy’s use of capital should be monitored closely as these figures can have long-term implications on its investing and financing strategies.
Balance Sheet & Leverage Analysis 🟡
Analyzing balance sheet ratios highlights Entergy's leverage and potentially impacts future obligations. Debt-to-equity trends indicate high leverage, while liquidity ratios show pressured short-term capabilities.
| Year | 2024 | 2023 | 2022 |
|---|---|---|---|
| Debt-to-Equity | 191.28% | 179.06% | 205.82% |
| Debt-to-Assets | 44.63% | 43.96% | 45.67% |
| Debt-to-Capital | 65.67% | 64.17% | 67.30% |
| Net Debt to EBITDA | 5.57x | 5.30x | 6.26x |
| Current Ratio | 0.72 | 0.57 | 0.64 |
| Quick Ratio | 0.43 | 0.32 | 0.43 |
| Financial Leverage | 4.29 | 4.07 | 4.51 |
The leverage employed by Entergy warrants caution, as high leverage may impact its ability to meet ongoing financial commitments.
Fundamental Strength & Profitability 🟢
Profitability ratios comprise a vital component of Entergy’s operational health. Evaluating return metrics demonstrates moderate efficiency in asset and equity utilization.
| Year | 2024 | 2023 | 2022 |
|---|---|---|---|
| Return on Equity | 7.02% | 16.12% | 8.44% |
| Return on Assets | 1.64% | 3.96% | 1.87% |
| Margins: Net | 8.93% | 19.45% | 7.97% |
| Margins: EBIT | 21.83% | 22.05% | 14.86% |
| Margins: EBITDA | 42.40% | 40.52% | 30.78% |
| Margins: Gross | 48.30% | 43.87% | 38.33% |
| Research & Development to Revenue | 0% | 0% | 0% |
Steady returns with expanding gross margins support Entergy's operational prowess and profitability. However, the absence of R&D investment could limit long-term strategic innovation.
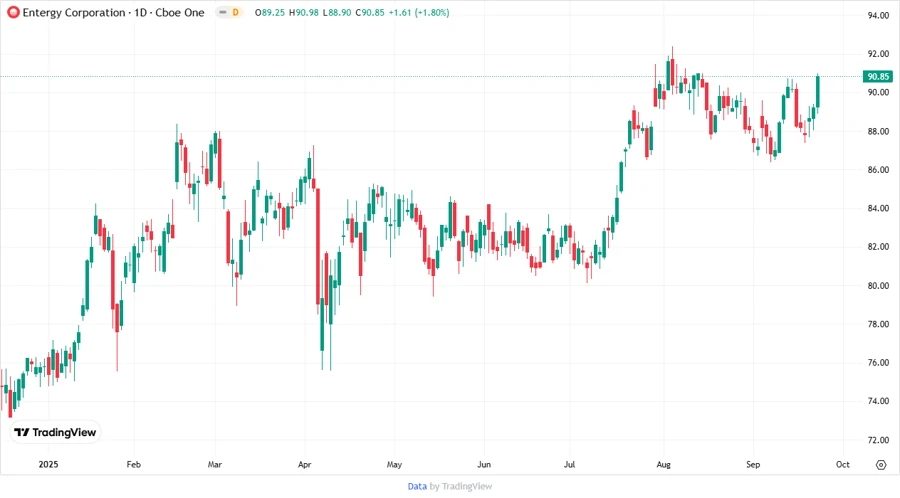
Price Development 📉
Dividend Scoring System ✅
| Criterion | Score | Visual |
|---|---|---|
| Dividend Yield | 3 | |
| Dividend Stability | 5 | |
| Dividend Growth | 4 | |
| Payout Ratio | 3 | |
| Financial Stability | 3 | |
| Dividend Continuity | 5 | |
| Cashflow Coverage | 2 | |
| Balance Sheet Quality | 3 |
Total Score: 28/40
Rating 🏆
Entergy Corporation stands out due to its long history of dividend payouts and growth trajectory. However, potential investors should remain cautious about high leverage and negative free cash flow. Overall, Entergy is recommended for dividend-oriented investors seeking stability and moderate growth.
Smart Data Insight
Master the Perfect Entry & Exit for this Stock
Don't leave your profits to chance. Historically, this stock follows specific seasonal patterns that institutional traders use to maximize returns.
- ✅ Identify the "Golden Buying Window"
- ✅ Avoid high-risk correction cycles
- ✅ Backtested data from the last 20+ years