June 23, 2026 a 11:31 am


ETN: Dividend Analysis - Eaton Corporation plc
Eaton Corporation plc presents a steady outlook with its robust dividend history spanning 55 years. The company's recent performance indicates modest but stable growth, with its dividends reflecting a conservative payout ratio. The overall financial health and upcoming market opportunities position Eaton as a reliable dividend-paying entity.
Overview 📊
The following table provides a snapshot of Eaton Corporation's sector as well as key dividend data:
| Key Metrics | Details |
|---|---|
| Sector | Industrials |
| Dividend yield | 1.07% |
| Current dividend per share | 4.19 USD |
| Dividend history | 55 years |
| Last cut or suspension | None |
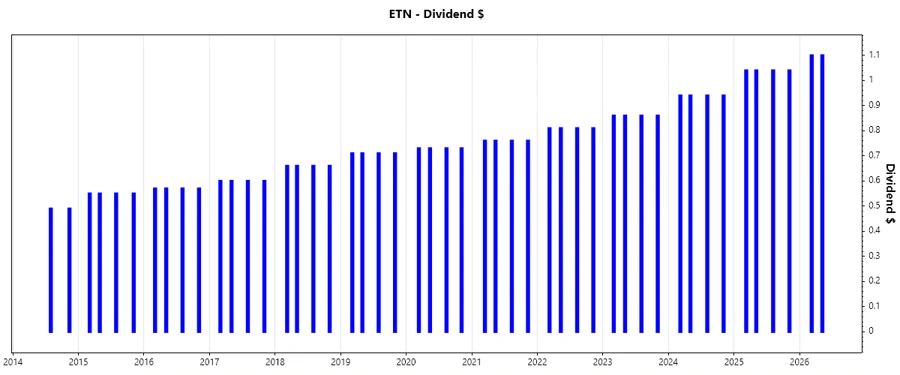
Dividend History 📉
The historical dividend track record is a testament to Eaton's consistency and financial resilience. This history is crucial for assessing the stability and growth potential of dividends.
| Year | Dividend Per Share (USD) |
|---|---|
| 2026 | 2.2 |
| 2025 | 4.16 |
| 2024 | 3.76 |
| 2023 | 3.44 |
| 2022 | 3.24 |
Dividend Growth 📈
A thorough analysis of Eaton's dividend growth over recent years reveals a pattern of incremental increases, reflective of a solid growth strategy.
| Time | Growth |
|---|---|
| 3 years | 8.69% |
| 5 years | 7.33% |
The average dividend growth is 7.33% over 5 years. This shows moderate but steady dividend growth.
Payout Ratio ✅
The payout ratio is a critical metric for understanding the sustainability of Eaton's dividend policy relative to earnings and cash flow.
| Key figure ratio | Percentage |
|---|---|
| EPS-based | 40.74% |
| Free cash flow-based | 34.64% |
The EPS payout ratio at 40.74% and FCF payout at 34.64% indicate a conservative approach, allowing room for further reinvestment and dividend increases.
Cashflow & Capital Efficiency 📊
Analyzing cash flow and capital efficiency reveals insights into Eaton's operational efficacy and fiscal prudence.
| 2023 | 2024 | 2025 |
|---|---|---|
| Free Cash Flow Yield: 2.98% | Free Cash Flow Yield: 2.67% | Free Cash Flow Yield: 2.87% |
| Earnings Yield: 3.35% | Earnings Yield: 2.88% | Earnings Yield: 3.31% |
| CAPEX to Operating Cash Flow: 20.89% | CAPEX to Operating Cash Flow: 18.67% | CAPEX to Operating Cash Flow: 20.55% |
| Stock-based Compensation to Revenue: 0% | Stock-based Compensation to Revenue: 0% | Stock-based Compensation to Revenue: -0.18% |
| Free Cash Flow / Operating Cash Flow Ratio: 79.11% | Free Cash Flow / Operating Cash Flow Ratio: 81.33% | Free Cash Flow / Operating Cash Flow Ratio: 79.44% |
Eaton displays a stable cash flow with effective capital management, highlighted by its robust FCF and operating cash flow conversion.
Balance Sheet & Leverage Analysis 🗣️
Eaton's balance sheet analysis reflects its sound leverage strategy and stability in meeting short-term obligations and long-term debt servicing.
| 2023 | 2024 | 2025 |
|---|---|---|
| Debt-to-Equity: 51.49% | Debt-to-Equity: 53.12% | Debt-to-Equity: 57.50% |
| Debt-to-Assets: 25.50% | Debt-to-Assets: 25.59% | Debt-to-Assets: 27.08% |
| Debt-to-Capital: 33.99% | Debt-to-Capital: 34.69% | Debt-to-Capital: 36.51% |
| Net Debt to EBITDA: 1.88 | Net Debt to EBITDA: 1.65 | Net Debt to EBITDA: 1.77 |
| Current Ratio: 1.51 | Current Ratio: 1.50 | Current Ratio: 1.32 |
| Quick Ratio: 1.02 | Quick Ratio: 0.96 | Quick Ratio: 0.81 |
| Financial Leverage: 2.02 | Financial Leverage: 2.07 | Financial Leverage: 2.12 |
The ratios reflect a manageable level of debt and strong solvency, providing a buffer against market volatility.
Fundamental Strength & Profitability 📈
Fundamentals such as ROE, ROA, and profit margins are key indicators of Eaton's profitability and financial health.
| 2023 | 2024 | 2025 |
|---|---|---|
| Return on Equity: 16.90% | Return on Equity: 20.52% | Return on Equity: 21.05% |
| Return on Assets: 8.37% | Return on Assets: 9.89% | Return on Assets: 9.91% |
| Net Margin: 13.87% | Net Margin: 15.25% | Net Margin: 14.90% |
| EBIT Margin: 17.39% | EBIT Margin: 18.93% | EBIT Margin: 18.93% |
| EBITDA Margin: 21.39% | EBITDA Margin: 22.63% | EBITDA Margin: 21.67% |
| Gross Margin: 36.36% | Gross Margin: 38.18% | Gross Margin: 37.59% |
| R&D to Revenue: 3.25% | R&D to Revenue: 3.19% | R&D to Revenue: 2.90% |
Eaton's strong ROE and net margins underscore its efficiently managed operations and strategic advantage in its industry.
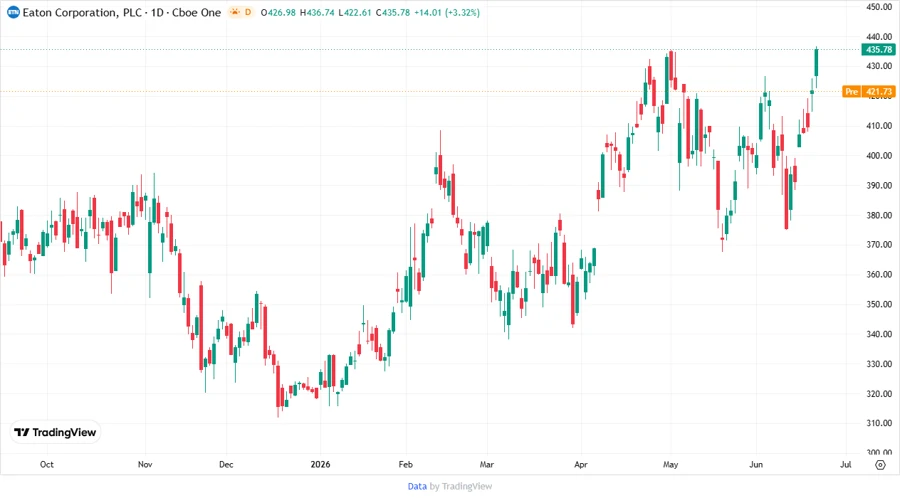
Price Development 📈
Dividend Scoring System 🔍
| Category | Score | |
|---|---|---|
| Dividend yield | 2 | |
| Dividend Stability | 5 | |
| Dividend Growth | 3 | |
| Payout ratio | 4 | |
| Financial stability | 4 | |
| Dividend continuity | 5 | |
| Cashflow Coverage | 5 | |
| Balance Sheet Quality | 4 |
Total Score: 32/40
Rating 📢
In conclusion, Eaton Corporation plc exhibits strong financial fundamentals with a reliable and stable dividend policy. With moderate growth potential and prudent fiscal management, it stands as a dependable investment option for dividend-focused investors. We recommend considering Eaton as part of a diversified, income-generating portfolio.
Smart Data Insight
Master the Perfect Entry & Exit for this Stock
Don't leave your profits to chance. Historically, this stock follows specific seasonal patterns that institutional traders use to maximize returns.
- ✅ Identify the "Golden Buying Window"
- ✅ Avoid high-risk correction cycles
- ✅ Backtested data from the last 20+ years