
February 27, 2026 a 07:31 am

ETN: Dividend Analysis - Eaton Corporation plc
Eaton Corporation plc is a strong player in the power management industry, with a robust dividend history spanning over five decades. The consistent growth in dividend payments demonstrates the company's commitment to returning value to shareholders, combined with sound financial management. This analysis will explore various aspects of Eaton's dividend performance, including its growth, stability, and the underlying financial metrics supporting these payments.
📊 Overview
Eaton operates in the Industrials sector, with a market-leading position in power management solutions. Here’s a snapshot of its key dividend metrics:
| Key Metric | Value |
|---|---|
| Sector | Industrials |
| Dividend yield | 1.10% |
| Current dividend per share | $4.19 |
| Dividend history | 54 years |
| Last cut or suspension | 2002 |
🗣️ Dividend History
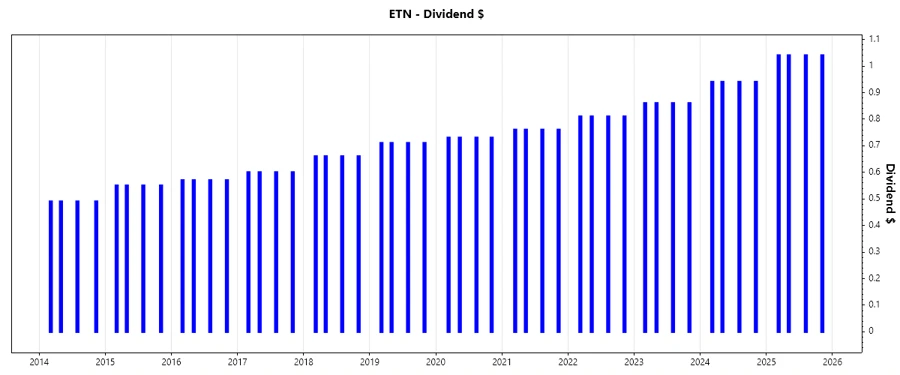
Eaton's longstanding dividend payments reflect its strong financial health and management’s commitment to shareholders. This history bolsters investor confidence and supports stock price stability.
| Year | Dividend per Share (USD) |
|---|---|
| 2025 | $4.16 |
| 2024 | $3.76 |
| 2023 | $3.44 |
| 2022 | $3.24 |
| 2021 | $3.04 |
📈 Dividend Growth
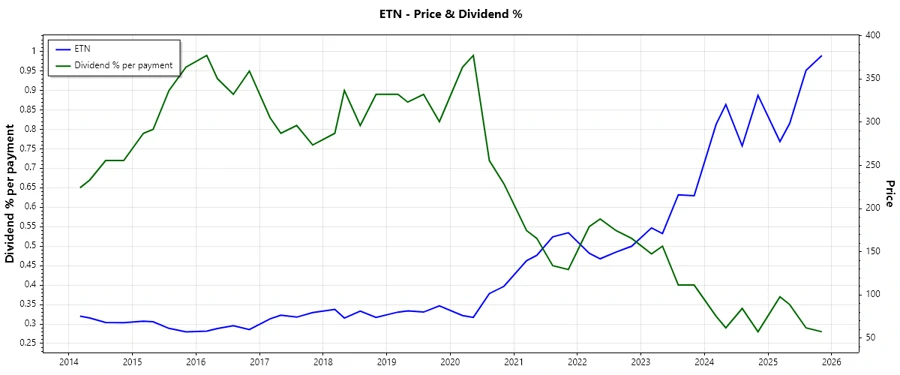
Evaluating the growth in dividends provides insight into a company’s financial trajectory and potential for future returns. Eaton has maintained moderate but consistent dividend growth.
| Time | Growth |
|---|---|
| 3 years | 8.69% |
| 5 years | 7.34% |
The average dividend growth is 7.34% over 5 years. This shows moderate but steady dividend growth.
✅ Payout Ratio
Payout ratios indicate the sustainability of dividend payments relative to earnings and cash flows. Eaton’s ratios reflect a balanced approach, supporting future payments.
| Key figure | Ratio |
|---|---|
| EPS-based | 39.77% |
| Free cash flow-based | 36.38% |
With 39.77% (EPS) and 36.38% (FCF), Eaton’s payouts are sustainable, indicating prudent dividend policy management.
🔍 Cashflow & Capital Efficiency
Cash flow metrics are vital for understanding operational efficiency and the capacity to sustain and grow dividend payments. Eaton displays strong cash flow generation and efficient capital use.
| Metric | 2023 | 2024 | 2025 |
|---|---|---|---|
| Free Cash Flow Yield | 2.98% | 2.67% | 3.62% |
| Earnings Yield | 3.35% | 2.88% | 3.31% |
| CAPEX to Operating Cash Flow | 20.89% | 18.67% | 0% |
| Stock-based Compensation to Revenue | 0% | 0% | -0.18% |
| Free Cash Flow / Operating Cash Flow Ratio | 79.11% | 81.33% | 100% |
These metrics highlight Eaton’s proficient management in cash flow optimization and strategic capital deployment, supporting its dividend strategy.
⚠️ Balance Sheet & Leverage Analysis
Evaluating leverage and balance sheet health determines financial stability. Eaton demonstrates sound debt management, maintaining low leverage.
| Metric | 2023 | 2024 | 2025 |
|---|---|---|---|
| Debt-to-Equity | 51.49% | 53.12% | 57.50% |
| Debt-to-Assets | 25.50% | 25.59% | 27.08% |
| Debt-to-Capital | 33.99% | 34.69% | 36.51% |
| Net Debt to EBITDA | 1.88 | 1.65 | 1.79 |
| Current Ratio | 1.51 | 0 | 1.32 |
| Quick Ratio | 1.02 | 0.96 | 0.81 |
| Financial Leverage | 2.02 | 2.08 | 2.12 |
The stable financial ratios reflect Eaton’s robust ability to manage its obligations without excessive leverage, ensuring financial stability.
📉 Fundamental Strength & Profitability
Profitability metrics illustrate operational efficiency and financial strength. Eaton shows impressive returns, reinforcing its market position.
| Metric | 2023 | 2024 | 2025 |
|---|---|---|---|
| Return on Equity | 16.90% | 20.52% | 21.05% |
| Return on Assets | 8.37% | 9.89% | 9.91% |
| Net Margin | 13.87% | 15.25% | 14.90% |
| EBIT Margin | 17.40% | 18.93% | 18.76% |
| EBITDA Margin | 21.39% | 22.63% | 21.49% |
| Gross Margin | 36.36% | 38.18% | 37.59% |
| Research & Development to Revenue | 3.25% | 3.19% | 2.90% |
With solid ROE and margin metrics, Eaton demonstrates its ability to generate profits efficiently, underlining its strong operational framework.
📊 Price Development
🎯 Dividend Scoring System
| Category | Score | Scale |
|---|---|---|
| Dividend yield | 2 | |
| Dividend Stability | 5 | |
| Dividend growth | 4 | |
| Payout ratio | 5 | |
| Financial stability | 5 | |
| Dividend continuity | 5 | |
| Cashflow Coverage | 4 | |
| Balance Sheet Quality | 5 |
Overall Score: 35/40
📣 Rating
In conclusion, Eaton Corporation plc presents a compelling dividend profile supported by a strong track record, robust dividend growth, and excellent financial health. The consistent improvement in operational efficiency and prudent leverage management position Eaton as a reliable dividend investment within the Industrials sector. Investors seeking stability with moderate income growth potential may find Eaton an attractive addition to their portfolios.
Smart Data Insight
Master the Perfect Entry & Exit for this Stock
Don't leave your profits to chance. Historically, this stock follows specific seasonal patterns that institutional traders use to maximize returns.
- ✅ Identify the "Golden Buying Window"
- ✅ Avoid high-risk correction cycles
- ✅ Backtested data from the last 20+ years