January 01, 2026 a 03:31 pm
ETN: Dividend Analysis - Eaton Corporation plc
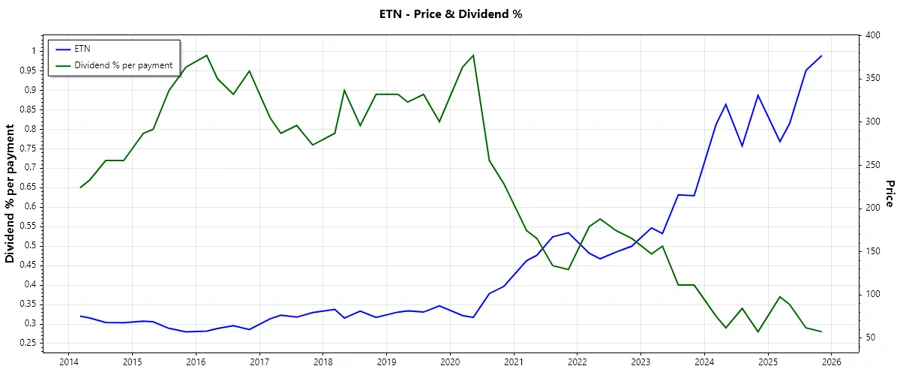
Eaton Corporation plc offers an impressive dividend profile characterized by a consistent history of dividend payments over 54 years with minimal interruptions. The company currently offers a modest dividend yield of approximately 1.10%, but with a stable payout ratio and a resilient cash flow situation, Eaton exhibits strong potential for sustaining its dividend capability. With promising returns on equity and assets, its investment stability deserves attention.
📊 Overview
Eaton Corporation plc is a well-established player in its sector, demonstrating robust financial metrics that indicate its capacity to sustain its dividend payouts.
| Category | Details |
|---|---|
| Sector | Industrials |
| Dividend Yield | 1.10% |
| Current Dividend Per Share | $3.77 USD |
| Dividend History | 54 years |
| Last Cut/Suspension | 2002 |
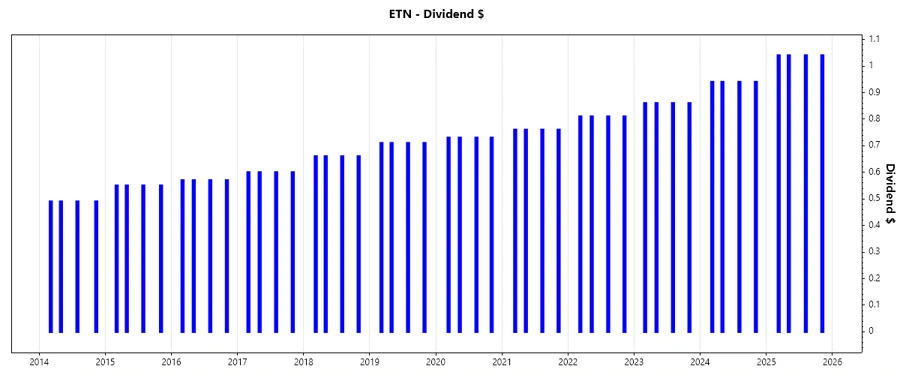
📈 Dividend History
The historical consistency of Eaton's dividend payments over five decades highlights its commitment to returning capital to shareholders. This is an invaluable indicator for income-focused investors as it reassures the potential for future dividend security.
| Year | Dividend Per Share (USD) |
|---|---|
| 2025 | $4.16 |
| 2024 | $3.76 |
| 2023 | $3.44 |
| 2022 | $3.24 |
| 2021 | $3.04 |
🔄 Dividend Growth
Tracking the growth of Eaton's dividends provides insight into its financial health and strategic allocation of capital. Notably, steady growth over the long term enhances investor confidence.
| Time | Growth |
|---|---|
| 3 years | 8.69% |
| 5 years | 7.34% |
The average dividend growth is 7.34% over 5 years. This shows moderate but steady dividend growth.
⚖️ Payout Ratio
Payout ratios indicate the proportion of earnings distributed as dividends. Lower ratios suggest room for growth or stability in dividend payments.
| Key Figure | Ratio |
|---|---|
| EPS-based | 37.35% |
| Free cash flow-based | 38.07% |
With an EPS-based payout ratio of 37.35% and a free cash flow payout ratio of 38.07%, Eaton demonstrates a balanced distribution of profits, providing a cushion for maintaining dividends amidst earnings fluctuations.
💵 Cashflow & Capital Efficiency
Examining cash flow metrics provides insight into Eaton's ability to generate cash to cover operating expenses and investment needs. Efficient capital deployment enhances shareholder value.
| Metric | 2024 | 2023 | 2022 |
|---|---|---|---|
| Free Cash Flow Yield | 2.67% | 2.98% | 3.09% |
| Earnings Yield | 2.88% | 3.35% | 3.93% |
| CAPEX to Operating Cash Flow | 18.67% | 20.89% | 23.61% |
| Stock-based Compensation to Revenue | 0% | 0% | 0% |
| Free Cash Flow / Operating Cash Flow Ratio | 81.33% | 79.11% | 76.39% |
Eaton's stability in free cash flow generation with strategic capital investments reflects prudent financial management and sustained capital efficiency.
💼 Balance Sheet & Leverage Analysis
Strong balance sheet metrics reflect efficient financial management, indicating the company's ability to service debt and withstand economic challenges.
| Metric | 2024 | 2023 | 2022 |
|---|---|---|---|
| Debt-to-Equity | 53.12% | 51.49% | 53.49% |
| Debt-to-Assets | 25.59% | 25.50% | 26.02% |
| Debt-to-Capital | 34.69% | 33.99% | 34.85% |
| Net Debt to EBITDA | 1.81 | 1.88 | 2.23 |
| Current Ratio | 1.28 | 1.51 | 1.38 |
| Quick Ratio | 0.96 | 1.02 | 0.84 |
| Financial Leverage | 2.08 | 2.02 | 2.06 |
Eaton's leverage ratios remain within healthy boundaries, suggesting the firm is well-managed in terms of debt obligations, adding stability to its financial health.
📉 Fundamental Strength & Profitability
Profitability metrics indicate Eaton's effectiveness in utilizing its resources to generate earnings, crucial for future growth and shareholder returns.
| Metric | 2024 | 2023 | 2022 |
|---|---|---|---|
| Return on Equity | 20.52% | 16.90% | 14.45% |
| Return on Assets | 9.89% | 8.37% | 7.03% |
| Net Margin | 15.25% | 13.87% | 11.86% |
| EBIT Margin | 18.93% | 17.40% | 14.45% |
| EBITDA Margin | 22.63% | 21.39% | 19.05% |
| Gross Margin | 38.18% | 36.36% | 33.28% |
| R&D to Revenue | 2.98% | 3.25% | 3.20% |
Eaton exhibits robust profitability ratios, reinforcing its capability to sustain operations and invest in future growth, contributing to shareholder value.
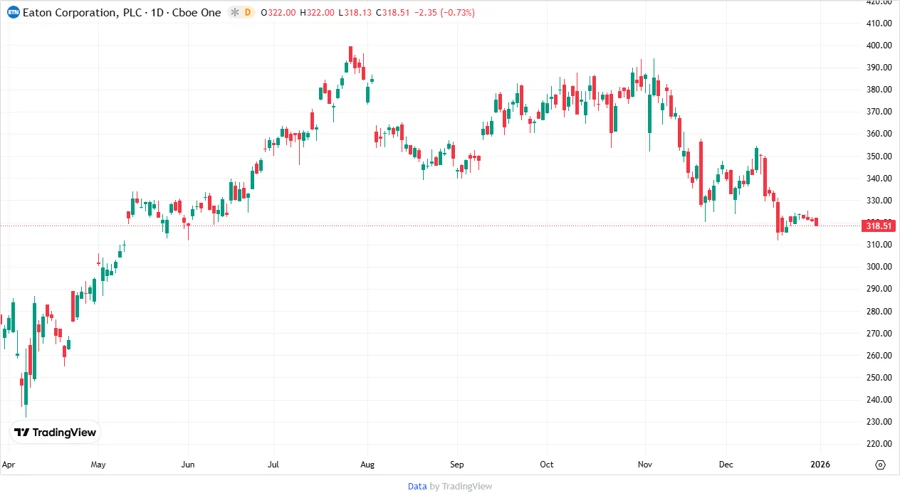
📉 Price Development
🗣️ Dividend Scoring System
| Criteria | Score (1-5) | Score Bar |
|---|---|---|
| Dividend Yield | 2 | |
| Dividend Stability | 5 | |
| Dividend Growth | 3 | |
| Payout Ratio | 4 | |
| Financial Stability | 5 | |
| Dividend Continuity | 5 | |
| Cashflow Coverage | 4 | |
| Balance Sheet Quality | 4 |
Total Score: 32/40
✅ Rating
Eaton Corporation plc stands out with a commendable track record in maintaining dividend payouts, with excellent financial stability and profitability cues. Though its yield may not appeal to those seeking high immediate returns, the company's steady dividend growth and strong financial health make it a reliable choice for long-term dividend investors. This rating gives Eaton a solid "Buy" recommendation for income-seeking portfolios desiring stable growth.