November 08, 2025 a 07:31 am
ETN: Dividend Analysis - Eaton Corporation plc
Eaton Corporation, a leading player in the industrial sector, showcases a robust dividend profile with a diversified approach to capital management. With an impressive 54-year history of dividend distributions and sustainable growth indices, Eaton appeals to dividend investors seeking reliable income streams combined with moderate capital appreciation potential.
📊 Overview
Eaton operates in the industrial sector, with a present dividend yield of 1.10%. The company offers a competitive current dividend per share of $3.77 and has a staggering record of 54 years of consecutive dividend payments, with the last reduction occurring in 2002.
| Detail | Value |
|---|---|
| Sector | Industrial |
| Dividend yield | 1.10 % |
| Current dividend per share | $3.77 |
| Dividend history | 54 years |
| Last cut or suspension | 2002 |
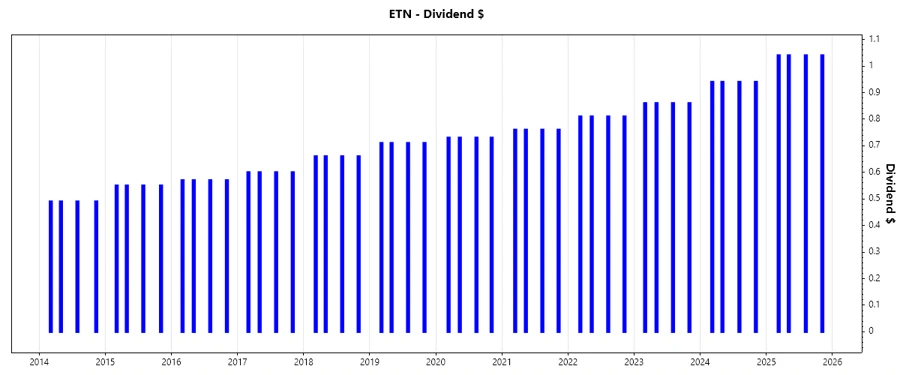
🗣️ Dividend History
Dividend history is crucial for assessing company stability and growth potential. Eaton's long-standing dividend record underscores consistent financial performance and investor commitment.
| Year | Dividend per Share |
|---|---|
| 2025 | $4.16 |
| 2024 | $3.76 |
| 2023 | $3.44 |
| 2022 | $3.24 |
| 2021 | $3.04 |
📈 Dividend Growth
Analyzing dividend growth provides insight into a company's future payout potential and investor returns. Eaton exhibits a 7.34% growth over the last three years and 5.77% over five years.
| Time | Growth |
|---|---|
| 3 years | 7.34 % |
| 5 years | 5.77 % |
The average dividend growth is 5.77% over 5 years. This shows moderate but steady dividend growth.
⚠️ Payout Ratio
Payout ratios are critical in assessing the sustainability of dividend payments. Eaton maintains a conservative EPS payout ratio of 37.35% and a Free Cash Flow payout ratio of 38.07%, indicating fiscal prudence.
| Key figure | Ratio |
|---|---|
| EPS-based | 37.35 % |
| Free cash flow-based | 38.07 % |
With a moderate EPS of 37.35% and FCF of 38.07%, Eaton showcases stable financial health and robustness in dividend commitments.
✅ Cashflow & Capital Efficiency
A comprehensive check on cashflow and capital efficiency indicates Eaton's robust capacity in maintaining dividend coverage, supported by steady free cash flow and efficient capital allocation.
| Metric | 2024 | 2023 | 2022 |
|---|---|---|---|
| Free Cash Flow Yield | 2.67 % | 2.98 % | 3.09 % |
| Earnings Yield | 2.88 % | 3.35 % | 3.93 % |
| CAPEX to Operating Cash Flow | 18.67 % | 20.89 % | 23.61 % |
| Stock-based Compensation to Revenue | 0 % | 0 % | 0 % |
| Free Cash Flow / Operating Cash Flow Ratio | 81.33 % | 79.11 % | 76.39 % |
Eaton's cash flow stability is underpinned by healthy yields and prudent investment, as reflected in its Free Cash Flow/Operating Cash Flow ratio and efficient CAPEX allocations.
🧮 Balance Sheet & Leverage Analysis
Balance sheet strength is vital for evaluating long-term financial health. Eaton's leverage metrics suggest a balanced approach to debt and equity, ensuring flexibility in financial strategy.
| Metric | 2024 | 2023 | 2022 |
|---|---|---|---|
| Debt-to-Equity | 0.53 | 0.51 | 0.53 |
| Debt-to-Assets | 0.26 | 0.26 | 0.26 |
| Debt-to-Capital | 0.35 | 0.34 | 0.35 |
| Net Debt to EBITDA | 1.65 | 1.87 | 2.23 |
| Current Ratio | 0 | 1.51 | 1.38 |
| Quick Ratio | 0.96 | 1.02 | 0.84 |
| Financial Leverage | 2.08 | 2.02 | 2.06 |
Eaton's prudent leverage ratios support a structurally sound and strategically flexible financial position, improving the company's ability to withstand market fluctuations.
📊 Fundamental Strength & Profitability
Eaton's fundamental strengths, illustrated through consistent ROE and attractive margins, affirm its competitive advantage and commitment to value creation.
| Metric | 2024 | 2023 | 2022 |
|---|---|---|---|
| Return on Equity | 0.21 | 0.17 | 0.14 |
| Return on Assets | 0.10 | 0.08 | 0.07 |
| Margins: Net | 0.15 | 0.14 | 0.12 |
| EBIT | 0.19 | 0.17 | 0.14 |
| EBITDA | 0.23 | 0.21 | 0.19 |
| Gross | 0.38 | 0.36 | 0.33 |
| Research & Development to Revenue | 0.03 | 0.03 | 0.03 |
Eaton's robust profitability metrics, including sustainable ROE and healthy margins, offer compelling evidence of its operational excellence and market position strength.
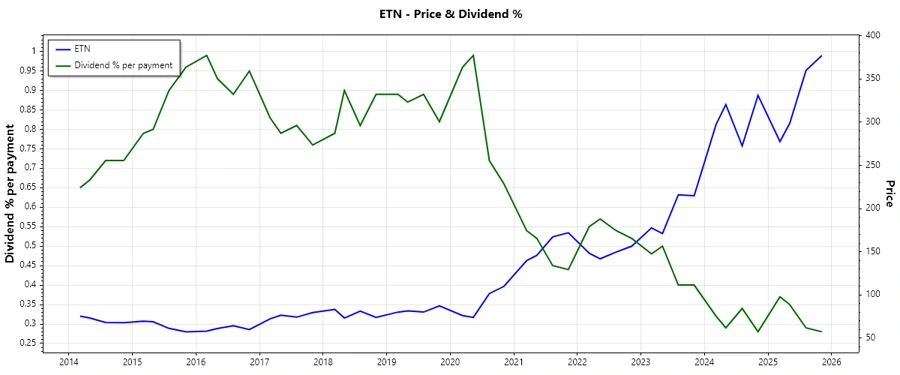
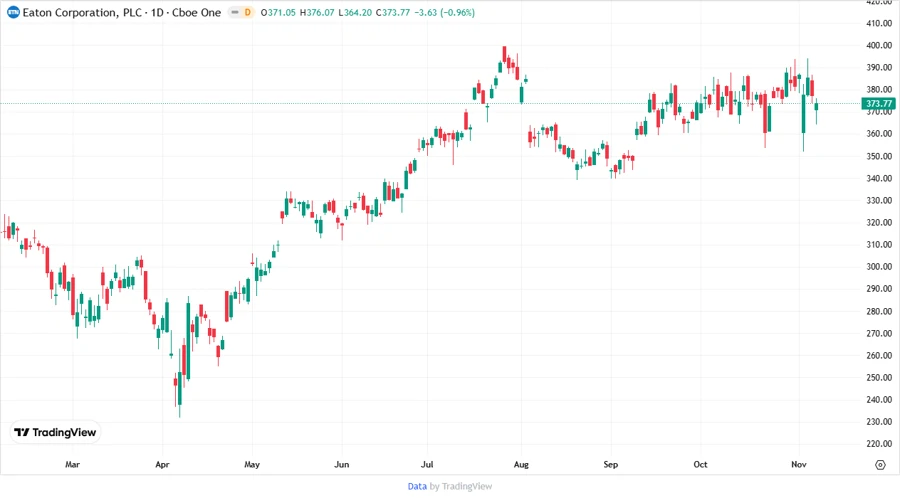
📉 Price Development
🧮 Dividend Scoring System
| Criteria | Score | Score Bar |
|---|---|---|
| Dividend yield | 3 | |
| Dividend Stability | 5 | |
| Dividend growth | 4 | |
| Payout ratio | 4 | |
| Financial stability | 4 | |
| Dividend continuity | 4 | |
| Cashflow Coverage | 4 | |
| Balance Sheet Quality | 4 |
Total Score: 32/40
🔍 Rating
Overall, Eaton Corporation presents a strong dividend-paying profile with significant emphasis on sustainability and market adaptability. Given the firm's robust financial health, consistent dividend history, and strategic operational efficiency, it garners a favorable rating for investors seeking moderate income stability combined with fractionate growth.
Smart Data Insight
Master the Perfect Entry & Exit for this Stock
Don't leave your profits to chance. Historically, this stock follows specific seasonal patterns that institutional traders use to maximize returns.
- ✅ Identify the "Golden Buying Window"
- ✅ Avoid high-risk correction cycles
- ✅ Backtested data from the last 20+ years