June 06, 2025 a 12:46 pm


ETN: Dividend Analysis - Eaton Corporation plc
Eaton Corporation plc displays a robust dividend profile with a notable history of consistent payments spanning 54 years, portraying a hallmark of stability and reliability. Their current dividend yield of 1.33% is a reflection of steady but moderate returns to shareholders. The company has successfully maintained its dividend without any recent cuts or suspensions, bolstering investor confidence. With a considerable growth rate in dividends over both the 3-year (7.34%) and 5-year (5.77%) horizons, Eaton exhibits a consistent upward trend in shareholder value distribution.
Overview 📊
The following table highlights key metrics that provide an overview of Eaton's dividend prowess and sector alignment.
| Metric | Value |
|---|---|
| Sector | Industrials |
| Dividend yield | 1.33% |
| Current dividend per share | 3.77 USD |
| Dividend history | 54 years |
| Last cut or suspension | None |
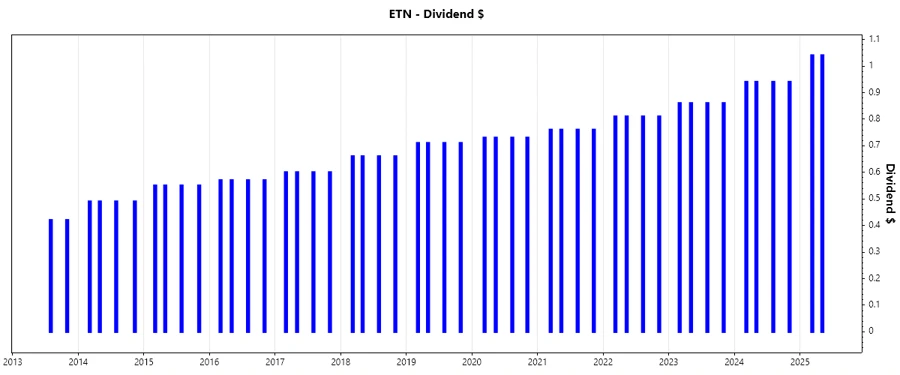
Dividend History 🗣️
Eaton's enduring dividend history indicates a steadfast commitment to rewarding shareholders. Its ability to sustain and incrementally raise dividends is an imperative marker of financial health and operational stability.
| Year | Dividend per Share (USD) |
|---|---|
| 2025 | 2.08 |
| 2024 | 3.76 |
| 2023 | 3.44 |
| 2022 | 3.24 |
| 2021 | 3.04 |
Dividend Growth 📈
An emphasis on growth is essential, as Eaton's dividend growth over 3-year and 5-year terms stands as an indicator of its strategic forward momentum.
| Time | Growth |
|---|---|
| 3 years | 7.34% |
| 5 years | 5.77% |
The average dividend growth is 5.77% over 5 years. This shows moderate but steady dividend growth.
Payout Ratio ⚖️
Understanding the payout ratio helps in gauging the sustainability of dividends. Eaton demonstrates prudent financial management, evident in their relatively conservative payout metrics.
| Key figure | Ratio |
|---|---|
| EPS-based | 37.58% |
| Free cash flow-based | 42.60% |
The company's EPS-based and FCF-based payout ratios, at 37.58% and 42.60%, respectively, underscore a balanced dividend policy aligned with business fundamentals.
Cashflow & Capital Efficiency 💰
Analyzing cash flow and capital efficiency is crucial for understanding Eaton's operational vitality and effectiveness in capital utilization.
| Metric | 2024 | 2023 | 2022 |
|---|---|---|---|
| Free Cash Flow Yield | 2.67% | 2.98% | 3.09% |
| Earnings Yield | 2.88% | 3.35% | 3.93% |
| CAPEX to Operating Cash Flow | 18.67% | 20.89% | 23.61% |
| Stock-based Compensation to Revenue | 0.00% | 0.00% | 0.47% |
| Free Cash Flow / Operating Cash Flow Ratio | 81.33% | 79.11% | 76.39% |
The cash flow metrics indicate firm operational cash flow generation backing stable dividend payouts, complemented by efficient capital allocation strategies.
Balance Sheet & Leverage Analysis 📊
Assessing the balance sheet health provides insight into Eaton's leverage positioning and financial stability, vital for long-term sustainability.
| Metric | 2024 | 2023 | 2022 |
|---|---|---|---|
| Debt-to-Equity | 0.53 | 0.51 | 0.53 |
| Debt-to-Assets | 0.26 | 0.26 | 0.26 |
| Debt-to-Capital | 0.35 | 0.34 | 0.35 |
| Net Debt to EBITDA | 1.55 | 1.90 | 2.91 |
| Current Ratio | 1.51 | 1.51 | 1.37 |
| Quick Ratio | 0.96 | 1.02 | 0.84 |
| Financial Leverage | 2.08 | 2.02 | 2.06 |
With controlled leverage ratios and strong current and quick ratios, Eaton's financial structure is well-positioned to handle obligations and sustain operations.
Fundamental Strength & Profitability 📈
Evaluating the profitability ratios reveals Eaton's operational efficiency and capacity to generate returns on invested capital.
| Metric | 2024 | 2023 | 2022 |
|---|---|---|---|
| Return on Equity | 20.52% | 16.90% | 14.45% |
| Return on Assets | 9.89% | 8.37% | 7.03% |
| Net Margin | 15.25% | 13.87% | 11.86% |
| EBIT Margin | 18.88% | 17.15% | 14.72% |
| EBITDA Margin | 22.63% | 21.14% | 14.61% |
| Gross Margin | 38.20% | 36.36% | 33.19% |
| Research & Development to Revenue | 3.19% | 3.25% | 3.20% |
Eaton's consistent margins and strong returns on equity and assets showcase a profitable and effective operational stance.
Price Development 📉
Dividend Scoring System ✅
The table below presents Eaton's grading against key criteria, providing a quantifiable outlook on dividend investment appeal.
| Criteria | Score (1-5) | Score Bar |
|---|---|---|
| Dividend yield | 3 | |
| Dividend Stability | 5 | |
| Dividend growth | 4 | |
| Payout ratio | 4 | |
| Financial stability | 5 | |
| Dividend continuity | 5 | |
| Cashflow Coverage | 4 | |
| Balance Sheet Quality | 5 |
Total Score: 35/40
Rating ⭐
In summary, Eaton Corporation plc presents a strong investment case with its consistent dividend history, prudent payout ratios, and robust financial health. The company demonstrates favorable growth potential and stability, making it a commendable choice for dividend-seeking investors.
Smart Data Insight
Master the Perfect Entry & Exit for this Stock
Don't leave your profits to chance. Historically, this stock follows specific seasonal patterns that institutional traders use to maximize returns.
- ✅ Identify the "Golden Buying Window"
- ✅ Avoid high-risk correction cycles
- ✅ Backtested data from the last 20+ years