June 27, 2026 a 09:03 am


ES: Trend and Support & Resistance Analysis - Eversource Energy
Eversource Energy, with its vast operational landscape in energy services, presents a mixed outlook in the recent period. Recent price movements indicate potential for both caution and opportunity as market trends and economic conditions continue to evolve. The stock's behavior in the coming months will likely depend on broader utility sector dynamics and regulatory developments. Investors should closely monitor support and resistance levels for strategic opportunities. With its core focus on reliable energy distribution, Eversource remains a significant player, though external economic factors should be considered in investment decisions.
Trend Analysis
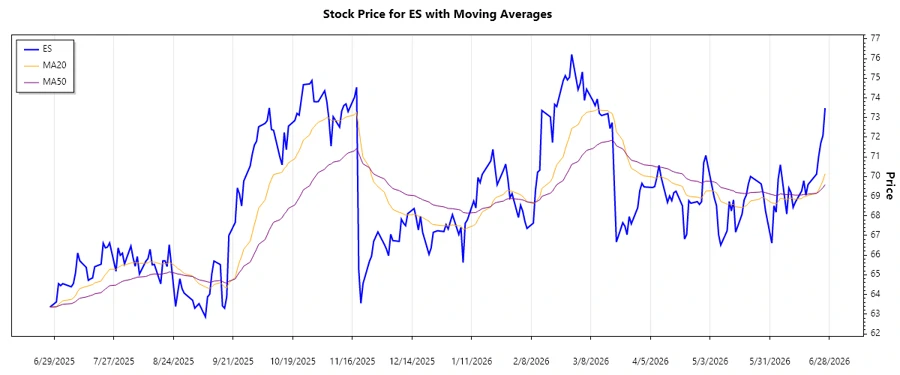
The analysis of Eversource Energy's stock price trend reveals recent fluctuations marked by minor upward and downward adjustments. To determine the prevailing trend, I calculated the Exponential Moving Averages (EMA) for 20 and 50 days based on closing prices. By examining their relationship, a clearer picture of the trend emerges:
| Date | Closing Price | Trend |
|---|---|---|
| 2026-06-26 | 73.48 | ▲ Uptrend |
| 2026-06-25 | 72.08 | ▼ Downtrend |
| 2026-06-24 | 71.71 | ▼ Downtrend |
| 2026-06-23 | 71.03 | ▼ Downtrend |
| 2026-06-22 | 70.12 | ▼ Downtrend |
| 2026-06-18 | 69.59 | ▼ Downtrend |
| 2026-06-17 | 69.05 | ▼ Downtrend |
Analysis of the EMAs suggests a prevailing downtrend, as demonstrated by the EMA20 being lower than the EMA50 recently. The fluctuations in EMA values show investor sentiment potentially influenced by broader market conditions.
Support- and Resistance
Determining potential support and resistance zones for Eversource Energy provides insight into future price movements. Calculated using historical data, these zones highlight critical thresholds the stock may encounter:
| Zone Type | Price From | Price To |
|---|---|---|
| Support | 65.00 | 66.00 |
| Support | 67.50 | 68.50 |
| Resistance | 73.50 | 74.50 |
| Resistance | 75.00 | 76.00 |
The current price level is hovering near a key support zone (67.50 - 68.50), signaling potential buying interest if prices remain steady. Conversely, resistance areas could pose challenges if there's a rally.
Conclusion
The analysis of Eversource Energy's recent stock data suggests a predominating downtrend, with discerning investors noting potential short-term selling pressure. At the same time, critical support and resistance zones offer strategic entry and exit points. Maintaining vigilance over these zones can be beneficial, especially in a volatile market environment. Eversource's broader economic context and core industry stability may lend a buffer to market disruptions. Future investment decisions should consider both potential rewards and inherent risks in price fluctuations.
Smart Data Insight
Master the Perfect Entry & Exit for this Stock
Don't leave your profits to chance. Historically, this stock follows specific seasonal patterns that institutional traders use to maximize returns.
- ✅ Identify the "Golden Buying Window"
- ✅ Avoid high-risk correction cycles
- ✅ Backtested data from the last 20+ years