May 17, 2026 a 08:15 am

ES: Trend and Support & Resistance Analysis - Eversource Energy
The analysis of Eversource Energy stock reveals a recent trend characterized by fluctuating prices. The stock's performance is influenced by its diverse operations in the energy delivery business, including electricity, natural gas, and water services. Understanding the technical indicators and support-resistance levels is crucial for predicting possible future movements. This analysis helps investors make informed decisions based on current trends and price zone data.
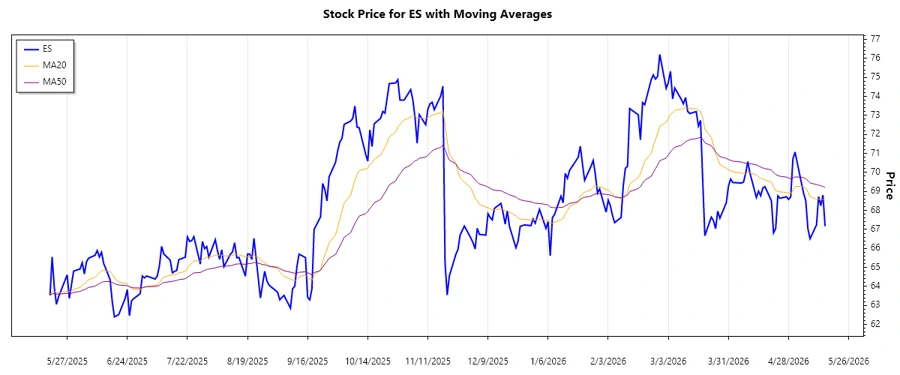
Trend Analysis
The recent data for Eversource Energy indicates a mixed trend. Calculating the EMA20 and EMA50, we observe a shift where the EMA20 is slightly below the EMA50, suggesting a minor ▼ Abwärtstrend. However, variations in daily prices suggest periods of volatility.
| Date | Close Price | Trend |
|---|---|---|
| 2026-05-15 | 67.17 | ▼ |
| 2026-05-14 | 68.81 | ▲ |
| 2026-05-13 | 68.25 | ▼ |
| 2026-05-12 | 68.73 | ▲ |
| 2026-05-11 | 67.24 | ▼ |
| 2026-05-08 | 66.51 | ▼ |
| 2026-05-07 | 67.04 | ▲ |
Overall, while short bursts of upward momentum are visible, the presence of predominantly declining prices suggests caution.
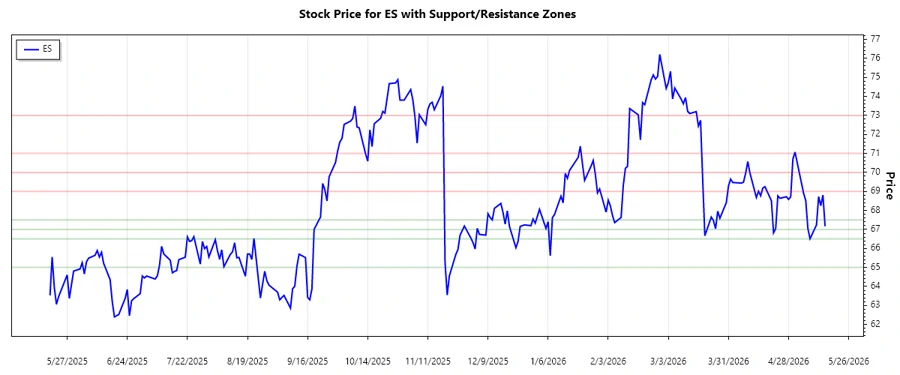
Support and Resistance
In scrutinizing support and resistance zones for Eversource Energy, critical levels become apparent. The recent analysis indicates the existence of two primary support zones around ~$65.0 and ~$67.0.
| Zone Type | Start | End |
|---|---|---|
| Support Zone 1 | 65.0 | 66.5 |
| Support Zone 2 | 67.0 | 67.5 |
| Resistance Zone 1 | 69.0 | 70.0 |
| Resistance Zone 2 | 71.0 | 73.0 |
The stock is currently within a support zone (~67.0 to ~67.5), offering potential reversal signals. Vigilance is necessary to assess whether prices will hold or breach past recent resistances.
Conclusion
In conclusion, Eversource Energy's stock shows a potential declining trend, with key support zones offering possible stability. The interplay of support and resistance levels will be crucial in the coming weeks. Investors should be cautious about the pervasive declines despite temporary peaks in prices. It's essential to monitor external factors like regulatory changes or industry shifts within Eversource's operational domain. A balanced approach analyzing both opportunities and risks is key for aligning investment strategies with technical insights.
Smart Data Insight
Master the Perfect Entry & Exit for this Stock
Don't leave your profits to chance. Historically, this stock follows specific seasonal patterns that institutional traders use to maximize returns.
- ✅ Identify the "Golden Buying Window"
- ✅ Avoid high-risk correction cycles
- ✅ Backtested data from the last 20+ years