September 18, 2025 a 01:15 pm
ES: Trend and Support & Resistance Analysis - Eversource Energy
Eversource Energy is a prominent utility company in the energy delivery business, operating across several northeastern U.S. states. With diversified operations in electricity, natural gas, solar, and water distribution, Eversource serves a diverse customer base. Recent stock movements show potential opportunities and risks influenced by its operational segments and regulatory environments. A technical analysis provides insights into the current market trends and key support and resistance levels.
Trend Analysis
| Date | Closing Price | Trend |
|---|---|---|
| 2025-09-17 | $63.30 | ▼ |
| 2025-09-16 | $63.42 | ▼ |
| 2025-09-15 | $65.52 | ▼ |
| 2025-09-12 | $65.70 | ▼ |
| 2025-09-11 | $65.05 | ▼ |
| 2025-09-10 | $64.01 | ▼ |
| 2025-09-09 | $63.88 | ▼ |
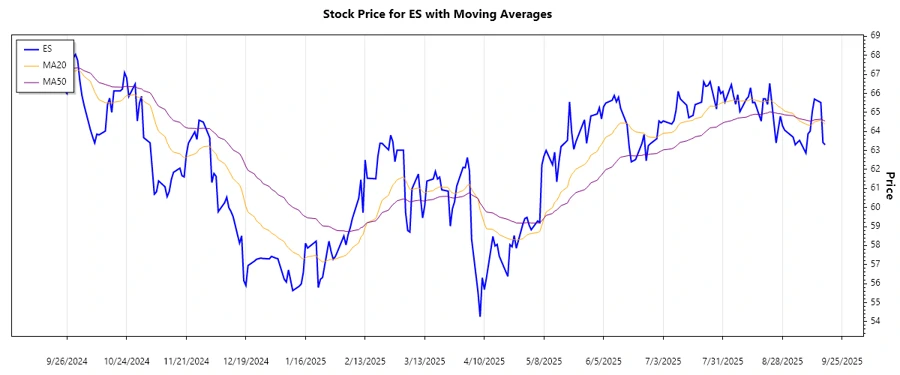
The calculated EMAs indicate a downward trend in the recent period, as evidenced by EMA20 being lower than EMA50. This suggests a bearish momentum.
Support and Resistance
| Zone Type | From | To |
|---|---|---|
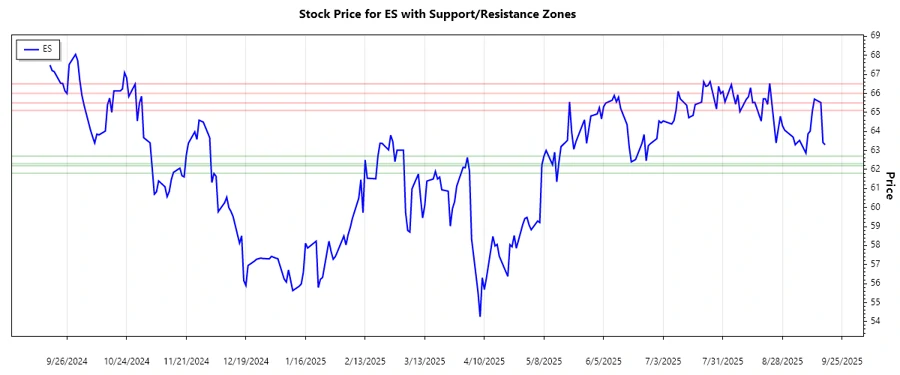
| Support | $62.30 | $62.70 |
| Support | $61.80 | $62.20 |
| Resistance | $65.10 | $65.50 |
| Resistance | $66.00 | $66.50 |
The current price of $63.30 is within the identified support zone, indicating potential buying interest at this level.
Conclusion
The technical analysis of Eversource Energy's stock reveals a bearish trend, but the proximity of the price to the support zones can signal potential investment opportunities as the market tester these lows. However, resistance zones pose challenges, where price reversals could occur if the bearish influence prevails. Investors should remain cautious, balancing the immediate potential for upward correction against the dominant downtrend dynamics. The operational stability and regulatory environment will continue to play pivotal roles in defining medium-term price directions.
Smart Data Insight
Master the Perfect Entry & Exit for this Stock
Don't leave your profits to chance. Historically, this stock follows specific seasonal patterns that institutional traders use to maximize returns.
- ✅ Identify the "Golden Buying Window"
- ✅ Avoid high-risk correction cycles
- ✅ Backtested data from the last 20+ years