May 08, 2026 a 10:15 am

ES: Fibonacci Analysis - Eversource Energy
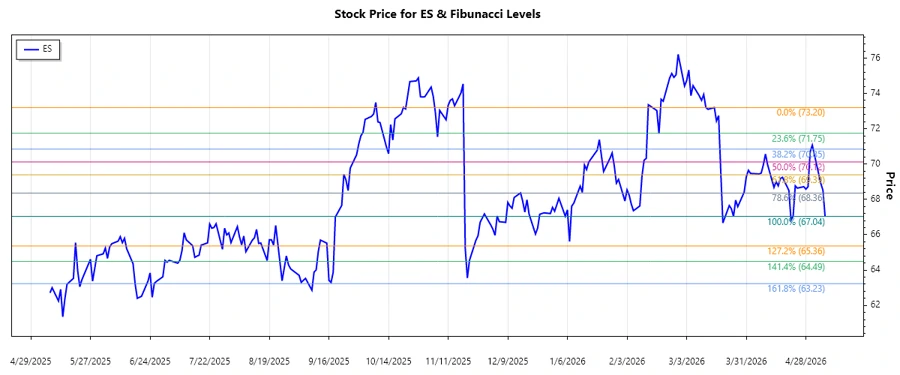
Eversource Energy has demonstrated resilience in the recent market conditions. As a major player in the energy delivery business, it has maintained steady performance across its segments. The analysis reveals a recent downward trend, suggesting potential price adjustments to be mindful of. With its utilities serving a significant customer base, Eversource remains a vital component in the region's energy infrastructure.
Fibonacci Analysis
| Parameter | Details |
|---|---|
| Start Date | 2026-03-16 |
| End Date | 2026-05-07 |
| High (Date & Price) | 2026-03-16 at $73.20 |
| Low (Date & Price) | 2026-05-07 at $67.04 |
| Fibonacci Level | Price Level |
|---|---|
| 0.236 | $68.586 |
| 0.382 | $69.608 |
| 0.5 | $70.12 |
| 0.618 | $70.632 |
| 0.786 | $71.408 |
The current price of $67.04 is not within the retracement zone. It appears to have breached below the last retracement level, indicating potential downside risk. Technically, this breach may act as a resistance point should the price attempt to climb back into the previous range.
Conclusion
Eversource Energy's stock is navigating a climate of downward pressure, setting the stage for strategic buy opportunities should stabilization occur at lower levels. Risks involve the stock breaking further below its support levels, while opportunities reside in its potential recovery influenced by regional energy demands. Analysts should closely monitor innovations in energy delivery and regulatory changes, given the firm's broad segment coverage and market position.
Smart Data Insight
Master the Perfect Entry & Exit for this Stock
Don't leave your profits to chance. Historically, this stock follows specific seasonal patterns that institutional traders use to maximize returns.
- ✅ Identify the "Golden Buying Window"
- ✅ Avoid high-risk correction cycles
- ✅ Backtested data from the last 20+ years