October 09, 2025 a 10:15 am
ES: Fibunacci Analysis - Eversource Energy
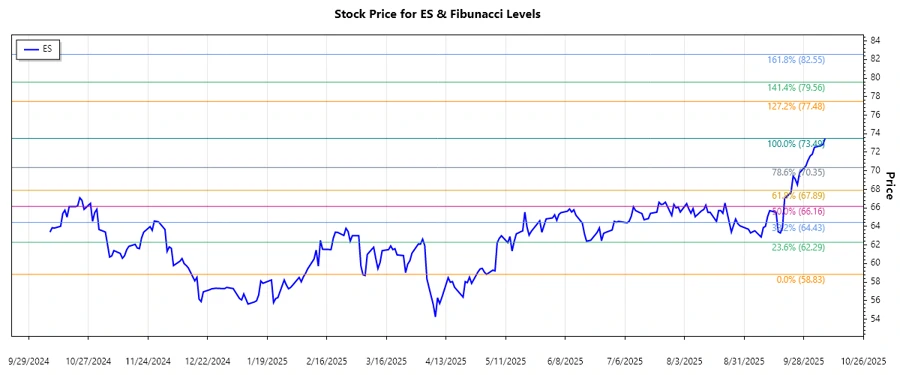
Eversource Energy (ES) is a prominent public utility holding company operating across various segments including electric, natural gas, solar power, and water distribution. The company's operations spread across Connecticut, Massachusetts, and New Hampshire, serving a wide range of customers from residential to municipal. In recent months, the stock has shown a clear upward trajectory, providing an interesting case for technical analysis.
Fibunacci Analysis
| Aspect | Details |
|---|---|
| Trend Start Date | 2025-05-02 |
| Trend End Date | 2025-10-08 |
| High Point (Price & Date) | $73.49 on 2025-10-08 |
| Low Point (Price & Date) | $58.83 on 2025-05-02 |
| Fibonacci Level | Price Level |
|---|---|
| 0.236 | $62.52 |
| 0.382 | $65.17 |
| 0.5 | $66.99 |
| 0.618 | $68.81 |
| 0.786 | $71.51 |
The current price of $73.49 is above the 0.786 Fibonacci retracement level, indicating potential for further bullish activity. Technically, the price has broken above significant resistance levels, suggesting continued strength.
Conclusion
The upward trend observed in Eversource Energy's stock, with its recent peaks, points to a robust bullish sentiment. This warrants careful consideration for investment, as the price has surpassed key Fibonacci levels, indicating strong momentum. However, investors should remain cautious of potential volatility due to market conditions. Analysts find these levels critical as they may serve as future support in pullbacks, offering possible entry points for bullish traders.
Smart Data Insight
Master the Perfect Entry & Exit for this Stock
Don't leave your profits to chance. Historically, this stock follows specific seasonal patterns that institutional traders use to maximize returns.
- ✅ Identify the "Golden Buying Window"
- ✅ Avoid high-risk correction cycles
- ✅ Backtested data from the last 20+ years