December 06, 2025 a 11:31 am

ES: Dividend Analysis - Eversource Energy
Eversource Energy, with a history of stable operations and consistent dividend payments, offers a compelling prospect for dividend-focused investors. Despite facing challenges common in the utility sector, the firm's long-standing commitment to returning value to shareholders underpins its attractive dividend yield. However, it is crucial to consider its cash flow dynamics and payout sustainability, especially given recent volatility in payout ratios.
📊 Overview
Eversource Energy operates in the utility sector, characterized by high regulation and steady cash flows. The company's current dividend yield stands at 4.51%, supported by a robust dividend history of 42 years. It's encouraging to see stability with no cuts or suspensions since 1999. However, the substantial current payout ratios prompt a careful assessment of future dividend sustainability.
| Metric | Value |
|---|---|
| Sector | Utility |
| Dividend Yield | 4.51% |
| Current Dividend per Share | 2.82 USD |
| Dividend History | 42 years |
| Last Cut or Suspension | 1999 |
🗣️ Dividend History
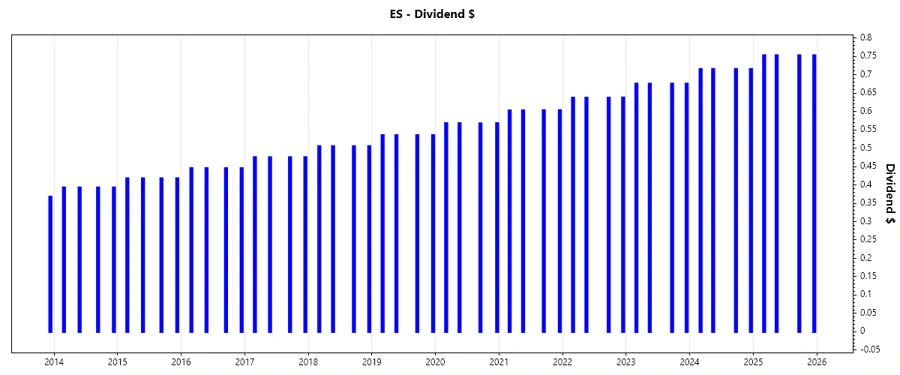
Eversource Energy’s consistent dividend payments since 1999 illustrate its commitment to shareholder returns. Reviewing the dividend history can provide insights into management's strategy and the firm's risk exposure. Historically, stable dividends often correspond with company resilience amidst economic fluctuations.
| Year | Dividend per Share (USD) |
|---|---|
| 2025 | 3.01 |
| 2024 | 2.86 |
| 2023 | 2.70 |
| 2022 | 2.55 |
| 2021 | 2.41 |
📈 Dividend Growth
Examining dividend growth is vital for gauging a company's financial health and forecasting future payouts. Eversource demonstrates a moderate growth trajectory, with an average increase of approximately 5.97% over the last five years. This steady growth helps maintain investor trust and predictability.
| Time | Growth |
|---|---|
| 3 years | 5.86% |
| 5 years | 5.97% |
The average dividend growth is 5.97% over 5 years. This shows moderate but steady dividend growth.
⚠️ Payout Ratio
The payout ratio is a critical measure of dividend safety, indicating how well earnings cover the dividend. Eversource's EPS-based payout ratio is 78.13%, a manageable figure, albeit on the higher side for utilities. However, the negative free cash flow-based ratio signals short-term liquidity challenges, necessitating further analysis into operational and earnings health.
| Key Figure | Ratio |
|---|---|
| EPS-based | 78.13% |
| Free cash flow-based | -198.40% |
Eversource's EPS-based payout ratio of 78.13% suggests a reasonable level of earnings coverage, while the -198.40% ratio, based on free cash flow, calls for attention, particularly on cash generation capabilities.
🔍 Cashflow & Capital Efficiency
Analyzing cash flow and capital efficiency provides a clearer picture of a company's operational viability and financial strategy. Eversource faces cash flow deficits, as indicated by negative free cash flow yields and a high CAPEX to operating cash flow ratio, highlighting the capital-intensive nature of its operations.
| Metric | 2022 | 2023 | 2024 |
|---|---|---|---|
| Free Cash Flow Yield | -3.58% | -12.47% | -11.30% |
| Earnings Yield | 4.83% | -2.05% | 3.95% |
| CAPEX to Operating Cash Flow | 1.43 | 2.63 | 2.07 |
| Stock-based Compensation to Revenue | 0.27% | 0.23% | 0% |
| Free Cash Flow / Operating Cash Flow Ratio | -0.43 | -1.63 | -1.07 |
The persistent negative cash flow ratios suggest a need for strategic reassessment to ensure long-term financial sustainability.
💼 Balance Sheet & Leverage Analysis
Understanding leverage and the balance sheet's health is crucial for assessing financial flexibility and risk. With a debt-to-equity ratio consistently around 1.90 and solid interest coverage, Eversource appears capable of servicing its obligations, although improved liquidity ratios would further mitigate risk.
| Metric | 2022 | 2023 | 2024 |
|---|---|---|---|
| Debt-to-Equity | 1.48 | 1.89 | 1.94 |
| Debt-to-Assets | 0.43 | 0.48 | 0.49 |
| Debt-to-Capital | 0.60 | 0.65 | 0.66 |
| Net Debt to EBITDA | 5.39 | 19.12 | 7.04 |
| Current Ratio | 0.62 | 0.67 | 0.75 |
| Quick Ratio | 0.57 | 0.59 | 0.67 |
| Financial Leverage | 3.44 | 3.92 | 3.96 |
Despite strong leverage ratios, the balance sheet's moderate liquidity and debt metrics indicate room for improvement to bolster financial stability.
🚀 Fundamental Strength & Profitability
Profitability metrics such as return on equity and margins are indicative of operational efficiency and core business strength. Eversource reveals a solid gross and EBIT margin while maintaining a respectable ROE, showcasing a capable, albeit not stellar, profitability backdrop.
| Metric | 2022 | 2023 | 2024 |
|---|---|---|---|
| Return on Equity | 9.08% | -3.12% | 5.40% |
| Return on Assets | 2.64% | -0.80% | 1.36% |
| Margins: Net | 11.43% | -3.71% | 6.82% |
| Margins: EBIT | 20.70% | 4.87% | 19.79% |
| Margins: EBITDA | 34.07% | 11.72% | 34.72% |
| Margins: Gross | 44.02% | 40.69% | 31.12% |
| Research & Development to Revenue | 0.00% | 0.00% | 0.00% |
While the metrics are robust, continuous improvement, especially in R&D and operational innovation, will be necessary for long-term competitiveness.
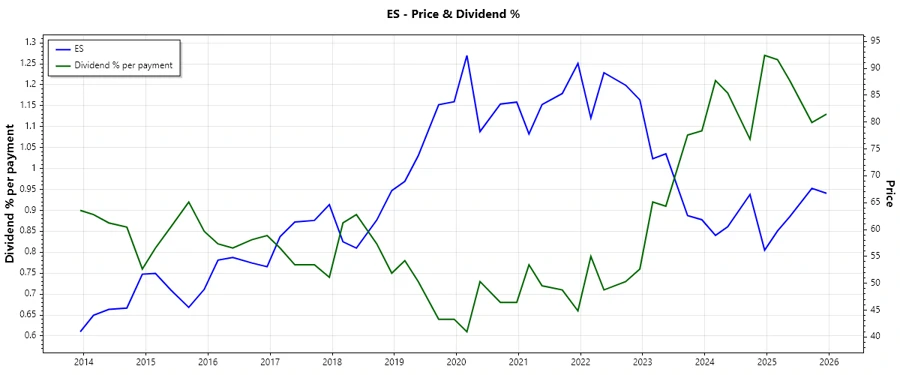
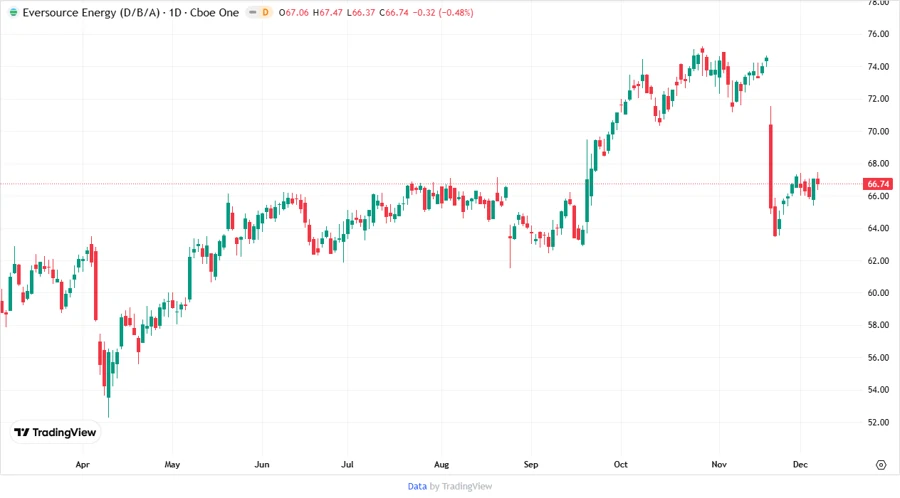
📉 Price Development
✅ Dividend Scoring System
| Criteria | Score | Score Bar |
|---|---|---|
| Dividend Yield | 4 | |
| Dividend Stability | 4 | |
| Dividend Growth | 3 | |
| Payout Ratio | 2 | |
| Financial Stability | 3 | |
| Dividend Continuity | 5 | |
| Cashflow Coverage | 2 | |
| Balance Sheet Quality | 3 |
Total Score: 26 out of 40
🏆 Rating
Eversource Energy presents a solid case for dividend investors, reinforced by its stable yield and consistent payout history. Although certain cash flow and coverage metrics raise concerns, the overall financial and operational fundamentals support ongoing dividends. Investors should consider economic uncertainties and the company's capital structure when evaluating long-term investment viability.