November 20, 2025 a 07:31 am


ES: Dividend Analysis - Eversource Energy
Eversource Energy, with its robust dividend profile and a market capitalization of over $24 billion, remains a focal point for dividend-focused investors. With a dividend history spanning over 42 years and consistent dividend growth, Eversource presents itself as a stable choice for income-driven portfolios. The utility sector's reliability and Eversource's strategic operations contribute to its enduring appeal.
📊 Overview
Eversource Energy operates within the utility sector, known for its stable cash flows and resilient dividend payouts. The company's current dividend yield stands at 4.39%, with a current dividend per share of 2.82 USD. A remarkable aspect of Eversource's dividend profile is its 42-year span of continual dividends, with no recent cuts or suspensions, indicating strong shareholder commitment.
| Sector | Dividend Yield (%) | Current Dividend/Share (USD) | Dividend History (Years) | Last Cut or Suspension |
|---|---|---|---|---|
| Utility | 4.39 | 2.82 | 42 | None |
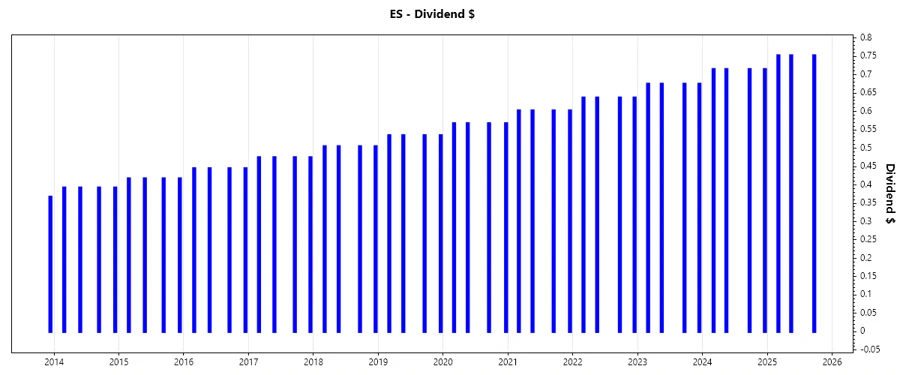
🗣️ Dividend History
Understanding dividend history is crucial as it reflects a company's commitment to returning profits to shareholders. Eversource Energy's consistent dividend payments over the decades showcase its financial stability and operational efficiency.
| Year | Dividend per Share (USD) |
|---|---|
| 2025 | 2.26 |
| 2024 | 2.86 |
| 2023 | 2.70 |
| 2022 | 2.55 |
| 2021 | 2.41 |
📈 Dividend Growth
Dividend growth signifies a company's improving financial health and its increasing ability to reward shareholders. Eversource Energy's growth signifies its stability and adaptation in the evolving energy market.
| Time | Growth (%) |
|---|---|
| 3 years | 5.87 |
| 5 years | 5.97 |
The average dividend growth is 5.97% over 5 years. This shows moderate but steady dividend growth.
✅ Payout Ratio
The payout ratio is an essential indicator of dividend sustainability. Eversource Energy's EPS-based payout ratio is 78.13%, while the FCF-based payout ratio is 0.03%. The EPS-based ratio is substantial, suggesting a commitment to dividends, but the FCF-based ratio indicates cautions regarding cash flows.
| Key Figure | Ratio (%) |
|---|---|
| EPS-based | 78.13 |
| Free cash flow-based | 0.03 |
The high EPS-based payout ratio hints at commitment, while the low FCF-based ratio suggests prudence in cash management.
📈 Cashflow & Capital Efficiency
Effective scrutiny of cash flow and capital allocation reveals a company’s operational resilience and potential for future growth. The table below highlights Eversource Energy's key financial metrics.
| Year | 2024 | 2023 | 2022 |
|---|---|---|---|
| Free Cash Flow Yield | -11.30 | -12.47 | -3.58 |
| Earnings Yield | 3.95 | -2.05 | 4.83 |
| CAPEX to Operating Cash Flow | 207.46 | 263.45 | 143.33 |
| Stock-based Compensation to Revenue | 0 | 0.23 | 0.27 |
| Free Cash Flow / Operating Cash Flow Ratio | -107.46 | -163.45 | -43.33 |
The figures suggest strained free cash flow relative to operational cash, indicating a need for optimizing capital expenditures.
📉 Balance Sheet & Leverage Analysis
A sound balance sheet and prudent leverage are critical for financial stability. Eversource Energy's balance sheet metrics provide insights into its leverage and liquidity position.
| Year | 2024 | 2023 | 2022 |
|---|---|---|---|
| Debt-to-Equity | 193.59 | 188.76 | 148.26 |
| Debt-to-Assets | 48.85 | 48.11 | 43.10 |
| Debt-to-Capital | 65.94 | 65.37 | 59.72 |
| Net Debt to EBITDA | 7.04 | 19.12 | 5.39 |
| Current Ratio | 0.76 | 0.67 | 0.62 |
| Quick Ratio | 0.67 | 0.59 | 0.57 |
| Financial Leverage | 3.96 | 3.92 | 3.44 |
High leverage levels indicate dependency on borrowed funds, necessitating caution in further debt accumulation.
📊 Fundamental Strength & Profitability
Analyzing core profitability and efficiency metrics provides insights into a firm’s operational vigor. Here’s a breakdown of Eversource's fundamental performance over recent years.
| Year | 2024 | 2023 | 2022 |
|---|---|---|---|
| Return on Equity | 5.40 | -3.12 | 9.08 |
| Return on Assets | 1.36 | -0.80 | 2.64 |
| Net Margin | 6.82 | -3.71 | 11.43 |
| EBIT Margin | 19.79 | 4.87 | 20.70 |
| EBITDA Margin | 34.72 | 11.72 | 34.07 |
| Gross Margin | 31.12 | 40.69 | 44.02 |
| R&D to Revenue | 0 | 0 | 0 |
Despite volatile margins, Eversource demonstrates strong return metrics, underscoring profitable core operations.
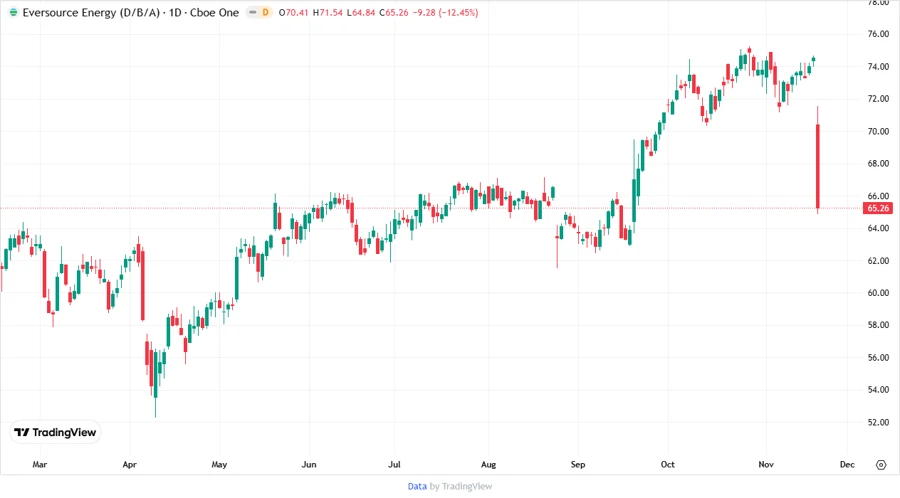
📈 Price Development
📊 Dividend Scoring System
| Criteria | Score | Score Bar |
|---|---|---|
| Dividend yield | 4 | |
| Dividend Stability | 5 | |
| Dividend growth | 4 | |
| Payout ratio | 3 | |
| Financial stability | 3 | |
| Dividend continuity | 5 | |
| Cashflow Coverage | 2 | |
| Balance Sheet Quality | 3 |
Total Score: 29/40
✅ Rating
In conclusion, Eversource Energy's dividend profile, marked by high stability and sustained growth, makes it a compelling candidate for conservative dividend investors. While leverage and cash flow challenges exist, its strong historical dividend performance provides reassurance. A carefully considered investment, factoring in sectoral and operational dynamics, is recommended.
Smart Data Insight
Master the Perfect Entry & Exit for this Stock
Don't leave your profits to chance. Historically, this stock follows specific seasonal patterns that institutional traders use to maximize returns.
- ✅ Identify the "Golden Buying Window"
- ✅ Avoid high-risk correction cycles
- ✅ Backtested data from the last 20+ years