
June 23, 2026 a 03:15 pm

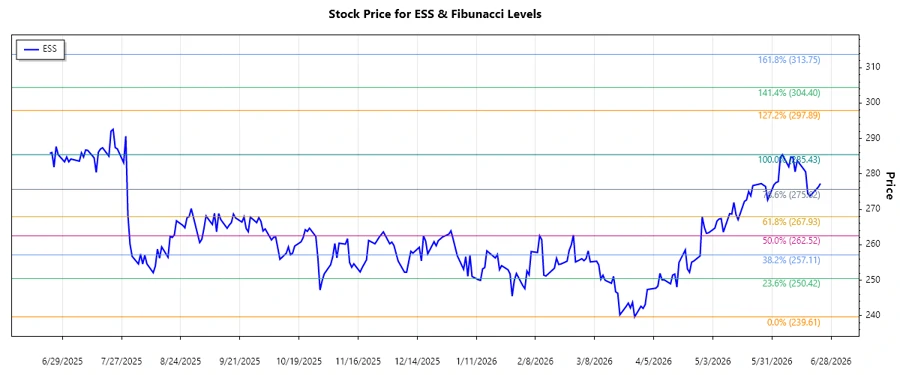
ESS: Fibunacci Analysis - Essex Property Trust, Inc.
Based on historical price data for Essex Property Trust, Inc., there is a definitive upward trend that has been identified. As the company continues to explore growth opportunities across the West Coast, its integration of investments and property management renders it a substantial player in the real estate sector. The recent market behavior of ESS suggests a resilience and potential for price appreciation. However, prospective investors should remain attentive to broader economic conditions that may impact the real estate market.
Fibonacci Analysis
| Detail | Description |
|---|---|
| Start Date of Trend | 2025-11-30 |
| End Date of Trend | 2026-06-10 |
| High Price (Date) | 285.43 (2026-06-05) |
| Low Price (Date) | 239.61 (2026-03-27) |
| Fibonacci Levels |
|
| Current Retracement Zone | None |
| Technical Interpretation | The current price is slightly above the highest Fibonacci level, suggesting potential for a pullback or new support formation near these levels. Investors may look for confirmation of strength or weakness to assess potential trade opportunities. |
Conclusion
Essex Property Trust, Inc. showcases a robust market position within the REIT sector, bolstered by strategic property acquisitions and effective management. With the ongoing economic uncertainties, the stock's recent upward trend offers an attractive opportunity; however, the urban nature of its properties may expose it to particular market risks. The technical analysis reveals key retracement levels that may serve as potential entry or exit points for investors. In conclusion, while ESS presents promising growth prospects, monitoring market conditions and key technical indicators is essential for risk management.
Smart Data Insight
Master the Perfect Entry & Exit for this Stock
Don't leave your profits to chance. Historically, this stock follows specific seasonal patterns that institutional traders use to maximize returns.
- ✅ Identify the "Golden Buying Window"
- ✅ Avoid high-risk correction cycles
- ✅ Backtested data from the last 20+ years