February 28, 2026 a 07:31 am

ESS: Dividend Analysis - Essex Property Trust, Inc.
Essex Property Trust, Inc. presents a compelling dividend profile, characterized by a long 33-year history of uninterrupted payouts, solid growth, and a respectable dividend yield. This consistency underscores the company's commitment to shareholder returns. However, the elevated payout ratios suggest a cautious approach is necessary. Monitoring cash flows and profitability will be key to sustaining future dividends in the face of economic uncertainties.
Overview 📊
Essex Property Trust, Inc.'s dividend profile highlights its reliability and attractiveness as a dividend-paying stock. The stable 4.04% yield and the consistent 33-year dividend history suggest an enduring commitment to shareholder returns. While no recent dividend cuts or suspensions provide confidence, the high payout ratio underscores the need for financial agility.
| Metric | Data |
|---|---|
| Sector | Real Estate |
| Dividend yield | 4.04% |
| Current dividend per share | 10.15 USD |
| Dividend history | 33 years |
| Last cut or suspension | None |
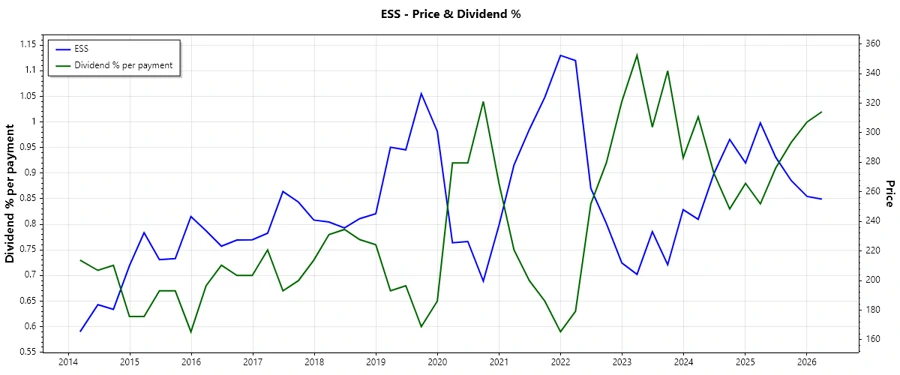
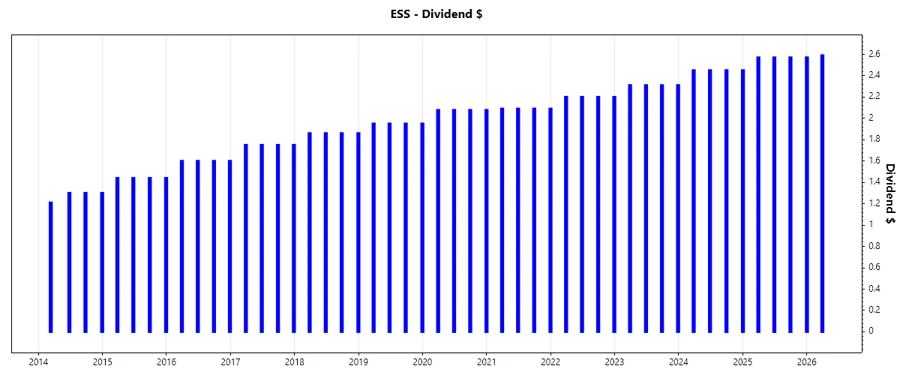
Dividend History 📈
The historical record of Essex Property Trust, Inc. underscores its reliability in dividend payments. The stability witnessed over 33 years accentuates the firm's focus on delivering shareholder value, a crucial aspect for income-focused investors. This long history of payments provides confidence in the company's future dividend sustainability.
| Year | Dividend per Share (USD) |
|---|---|
| 2026 | 5.16 |
| 2025 | 10.16 |
| 2024 | 7.35 |
| 2023 | 9.24 |
| 2022 | 8.8 |
Dividend Growth 🚀
Dividend growth is an essential metric for evaluating the future trajectory of shareholder returns. Essex Property Trust, Inc. offers modest growth, with a 3-year growth rate of 4.91% and a 5-year rate of 4.10%. Such growth rates project a balanced increase in dividends, ensuring steady income at competitive rates.
| Time | Growth |
|---|---|
| 3 years | 4.91% |
| 5 years | 4.10% |
The average dividend growth is 4.10% over 5 years. This shows moderate but steady dividend growth.
Payout Ratio 🤔
The payout ratio is a critical indicator of dividend sustainability. The EPS-based ratio at 97.26% suggests high profit allocation towards dividends, whereas the free cash flow-based ratio of 67.20% is slightly more conservative and indicative of a healthier payout strategy. These figures necessitate vigilant monitoring of earnings stability to prevent future strain on dividends.
| Key figure ratio | Percentage |
|---|---|
| EPS-based | 97.26% |
| Free cash flow-based | 67.20% |
Cashflow & Capital Efficiency 💼
The company's ability to generate cash inflow relative to its capital overhead determines its capacity to sustain dividend payments. Notably, Essex Property Trust reports a decent Free Cash Flow Yield of 5.92% with a balanced Earnings Yield. The operating cash flow ratio translates into a robust cash position, essential for supporting ongoing dividend disbursements.
| Year | 2025 | 2024 | 2023 |
|---|---|---|---|
| Free Cash Flow Yield | 6.37% | 5.08% | 5.27% |
| Earnings Yield | 3.99% | 4.04% | 2.55% |
| CAPEX to Operating Cash Flow | 9.38% | 12.77% | 14.32% |
| Stock-based Compensation to Revenue | 0.35% | 0.40% | 0.48% |
| Free Cash Flow / Operating Cash Flow Ratio | 100% | 87.23% | 85.68% |
Balance Sheet & Leverage Analysis 📊
A strong balance sheet fortifies a company's resilience amidst market fluctuations. Essex Property Trust, Inc. showcases decent leverage metrics, with a Debt-to-Equity ratio aligning with industry standards. While leverage is sustainably managed, close monitoring of debt levels can prevent potential constraints on capital allocation strategies.
| Year | 2025 | 2024 | 2023 |
|---|---|---|---|
| Debt-to-Equity | 124.58% | 120.17% | 115.64% |
| Debt-to-Assets | 52.46% | 51.47% | 50.73% |
| Debt-to-Capital | 55.47% | 54.58% | 53.63% |
| Net Debt to EBITDA | 4.72 | 4.05 | 4.93 |
| Current Ratio | 229.85% | 66.42% | 187.88% |
| Quick Ratio | 229.85% | 66.42% | 187.88% |
Fundamental Strength & Profitability 🏆
Determining the fundamental prowess and profitability provides insights into Essex Property Trust's operational effectiveness. Solid margins and returns on equity indicate the company's robust underlying financial health, supporting both operational and strategic initiatives aimed at enhancing shareholder value.
| Year | 2025 | 2024 | 2023 |
|---|---|---|---|
| Return on Equity | 12.14% | 13.39% | 7.48% |
| Return on Assets | 5.11% | 5.74% | 3.28% |
| Margins: Net | 35.38% | 41.79% | 24.31% |
| Margins: EBIT | 50.26% | 58.99% | 38.55% |
| Margins: EBITDA | 82.23% | 91.69% | 71.41% |
| Margins: Gross | 68.82% | 68.06% | 68.13% |
| Research & Development to Revenue | 0% | 0% | 0% |
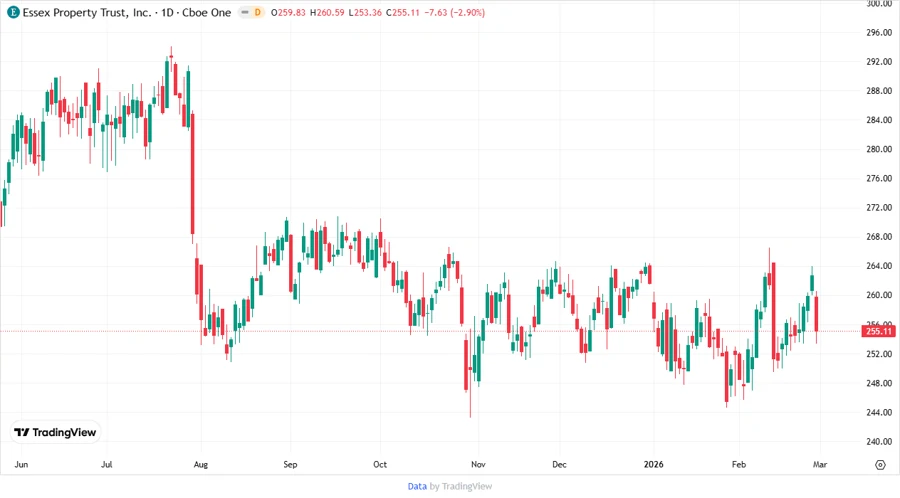
Price Development 🏷️
Dividend Scoring System 🔠
| Criteria | Score | Evaluation |
|---|---|---|
| Dividend yield | 4/5 | |
| Dividend Stability | 5/5 | |
| Dividend growth | 3/5 | |
| Payout ratio | 3/5 | |
| Financial stability | 4/5 | |
| Dividend continuity | 5/5 | |
| Cashflow Coverage | 4/5 | |
| Balance Sheet Quality | 3/5 |
Total Score: 31/40
Rating ⭐
Essex Property Trust, Inc. stands as a resilient dividend-paying tiltle, backed by a long-standing dividend history and a strategic focus on shareholder value. While the payout ratios are on the higher end, indicating potential liquidity risks, the strong fundamentals suggest continued dividend payouts. Overall, ESS represents a suitable investment for income-focused portfolios, recommending a cautious yet optimistic approach given its high yield, stable track record, and efficient capital management.