February 16, 2026 a 12:46 pm


ESS: Dividend Analysis - Essex Property Trust, Inc.
Essex Property Trust, Inc. stands out as a prominent player in the real estate sector, recognized for its consistent dividend history. With a dividend yield of 4.00%, it presents a solid option for income-focused investors. The company boasts 33 years of dividend history, showing its commitment to shareholder returns. However, high payout ratios may warrant close monitoring.
📊 Overview
Essex Property Trust operates in the Real Estate sector, providing a robust dividend yield of 4.00%. With a dividend per share of $10.16 and a laudable 33-year dividend history, Essex remains a reliable choice among dividend investors.
| Metric | Value |
|---|---|
| Sector | Real Estate |
| Dividend yield | 4.00% |
| Current dividend per share | $10.16 |
| Dividend history | 33 years |
| Last cut or suspension | None |
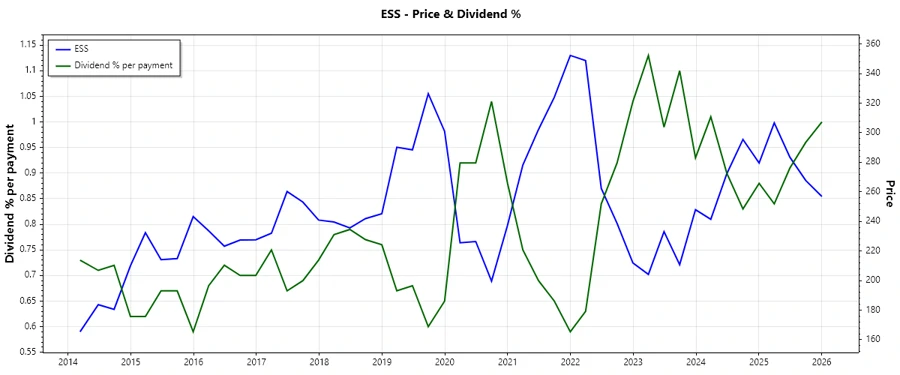
📈 Dividend History
Historical dividend analysis is critical as it showcases the consistency and reliability of returns over time, influencing investor confidence and decision-making.
| Year | Dividend per Share (USD) |
|---|---|
| 2026 | 2.57 |
| 2025 | 10.16 |
| 2024 | 7.35 |
| 2023 | 9.24 |
| 2022 | 8.80 |
🌱 Dividend Growth
Dividend growth indicates a company's ability to increase shareholder returns over time, reflecting financial health and management's commitment to return value to shareholders.
| Time | Growth |
|---|---|
| 3 years | 4.91% |
| 5 years | 4.10% |
The average dividend growth is 4.10% over 5 years. This shows moderate but steady dividend growth.
✅ Payout Ratio
Payout ratios provide insight into how much of a company's earnings and free cash flow are being returned to shareholders. This metric helps assess dividend sustainability.
| Key figure | Ratio |
|---|---|
| EPS-based | 97.38% |
| Free cash flow-based | 88.50% |
The high EPS payout ratio of 97.38% suggests limited room for reinvestment, while an 88.50% FCF payout may indicate potential sustainability concerns.
💡 Cashflow & Capital Efficiency
Assessing cash flow and capital efficiency metrics is vital to understanding a company’s ability to generate cash relative to capital investments, influencing dividend potential and investment returns.
| Metric | 2023 | 2024 | 2025 |
|---|---|---|---|
| Free Cash Flow Yield | 5.27% | 5.08% | 0% |
| Earnings Yield | 2.55% | 4.04% | 3.99% |
| CAPEX to Operating Cash Flow | 14.32% | 12.77% | 0% |
| Stock-based Compensation to Revenue | 0.48% | 0.40% | 0% |
| Free Cash Flow / Operating Cash Flow Ratio | 85.67% | 87.23% | 0% |
| Return on Invested Capital | 4.87% | 5.61% | 185.04% |
The cash flow stability and capital efficiency metrics indicate potential in cash generation, vital for sustaining dividends and funding growth.
🔍 Balance Sheet & Leverage Analysis
Strong balance sheet metrics are crucial for long-term financial stability, impacting the company's ability to manage debt and maintain liquidity.
| Metric | 2023 | 2024 | 2025 |
|---|---|---|---|
| Debt-to-Equity | 1.156 | 1.202 | 1.246 |
| Debt-to-Assets | 0.507 | 0.515 | 0.525 |
| Debt-to-Capital | 0.536 | 0.546 | 0.555 |
| Net Debt to EBITDA | 4.932 | 4.049 | 4.716 |
| Current Ratio | 0.000 | 0.664 | 0.000 |
| Quick Ratio | 1.879 | 0.664 | 0.000 |
| Financial Leverage | 2.280 | 2.335 | 2.375 |
The analysis of leverage ratios indicates a moderate to high level of debt, requiring careful management to avoid financial stress.
📊 Fundamental Strength & Profitability
Analyzing profitability and fundamental strength metrics can reveal the efficiency and profitability of the company's core operations and strategic decisions.
| Metric | 2023 | 2024 | 2025 |
|---|---|---|---|
| Return on Equity | 7.48% | 13.39% | 12.14% |
| Return on Assets | 3.28% | 5.74% | 5.11% |
| Net Margin | 24.31% | 41.79% | 35.38% |
| EBIT Margin | 38.55% | 58.99% | 44.07% |
| EBITDA Margin | 71.41% | 91.69% | 76.06% |
| Gross Margin | 68.13% | 68.06% | 68.82% |
| Research & Development to Revenue | 0% | 0% | 0% |
The company demonstrates commendable profitability margins, crucial for sustaining competitive advantages and ensuring dividend viability.
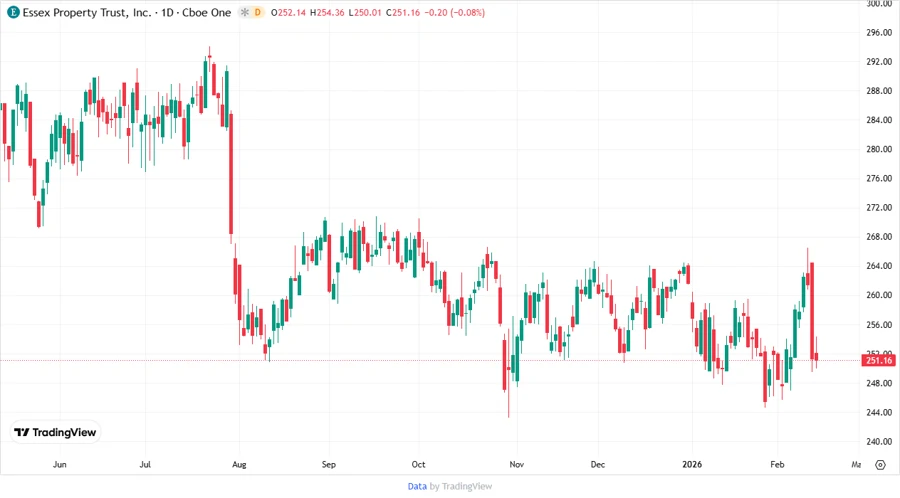
📉 Price Development
⭐ Dividend Scoring System
An insightful scoring system evaluates the company's dividend metrics to provide a comprehensive dividend assessment.
| Criteria | Score | Score Bar |
|---|---|---|
| Dividend yield | 4 | |
| Dividend Stability | 5 | |
| Dividend growth | 3 | |
| Payout ratio | 2 | |
| Financial stability | 3 | |
| Dividend continuity | 5 | |
| Cashflow Coverage | 3 | |
| Balance Sheet Quality | 3 |
Total Score: 28/40
🗣️ Rating
Essex Property Trust Inc. demonstrates a strong position in dividend continuity with a satisfactory yield, making it a commendable option for income-focused portfolios. Nevertheless, the elevated payout ratios and moderate dividend growth denote areas warranting consideration. Overall, Essex presents itself as a solid yet cautiously optimistic dividend investment prospect.
Smart Data Insight
Master the Perfect Entry & Exit for this Stock
Don't leave your profits to chance. Historically, this stock follows specific seasonal patterns that institutional traders use to maximize returns.
- ✅ Identify the "Golden Buying Window"
- ✅ Avoid high-risk correction cycles
- ✅ Backtested data from the last 20+ years