November 10, 2025 a 11:31 am


ESS: Dividend Analysis - Essex Property Trust, Inc.
Essex Property Trust, Inc., a prominent player in the real estate investment sector, boasts a significant presence with consistent dividend payouts over the past 32 years. Despite a recent cut in dividends in 2024, the company's commitment to shareholder returns remains strong, underpinned by its extensive asset base and strategic market positioning.
📊 Overview
Seeking investment stability? Here’s a comprehensive look at Essex Property Trust's dividend profile.
| Key Metric | Details |
|---|---|
| Sector | Real Estate Investment |
| Dividend Yield | 3.80% |
| Current Dividend Per Share | 9.66 USD |
| Dividend History | 32 years |
| Last Cut or Suspension | 2024 |
📈 Dividend History
Understanding a company's dividend history is crucial as it reveals not only the rate of returns to shareholders but also the management's commitment to sustained growth. Essex Property Trust has shown endurance over decades, yet recent changes require scrutiny.
| Year | Dividend Per Share (USD) |
|---|---|
| 2025 | 10.16 |
| 2024 | 7.35 |
| 2023 | 9.24 |
| 2022 | 8.80 |
| 2021 | 8.36 |
🔥 Dividend Growth
Dividend growth rates serve as indicators of financial health and potential future payouts. Observing trends over several years provides insights into strategic financial planning.
| Time | Growth |
|---|---|
| 3 Years | -4.20% |
| 5 Years | -1.18% |
The average dividend growth is -1.18% over 5 years. This shows a concerning trend of slight negative growth, reflecting recent financial challenges.
💰 Payout Ratio
A critical evaluation metric, the payout ratio illustrates the proportion of earnings paid as dividends, signaling if they are sustainable. Commonly, a lower ratio suggests room for infrastructure or future investments.
| Key Figure | Ratio |
|---|---|
| EPS-based | 73.49% |
| Free Cash Flow-based | 61.02% |
With a payout ratio of 73.49% (EPS) and 61.02% (FCF), Essex appears to balance rewarding shareholders and retaining earnings for future growth, yet it highlights a recent adjustment phase post-dividend cut.
📊 Cashflow & Capital Efficiency
These metrics give insights into cash reserves, operational effectiveness, and capital utilization, crucial for maintaining healthy investor returns.
| Year | 2022 | 2023 | 2024 |
|---|---|---|---|
| Free Cash Flow Yield | 5.89% | 5.27% | 5.08% |
| Earnings Yield | 2.96% | 2.55% | 4.04% |
| CAPEX/Operating Cash Flow | 0.167 | 0.143 | 0.128 |
| Stock-based Compensation/Revenue | 0.004 | 0.000 | 0.004 |
| Free Cash Flow / Operating Cash Flow | 0.833 | 0.857 | 0.872 |
These statistics denote consistent cash flow growth and efficient capital management by Essex, though recent swings in stock-based compensations warrant attention for alignment with long-term shareholder value.
⚖️ Balance Sheet & Leverage Analysis
The balance sheet reflects financial health, indicating ability to cover debts and supporting long-term sustainability.
| Year | 2022 | 2023 | 2024 |
|---|---|---|---|
| Debt-to-Equity | 1.054 | 1.156 | 1.202 |
| Debt-to-Assets | 0.487 | 0.507 | 0.515 |
| Debt-to-Capital | 0.513 | 0.536 | 0.546 |
| Net Debt to EBITDA | 5.01 | 4.93 | 4.33 |
| Current Ratio | 0.663 | 1.879 | 1.662 |
| Quick Ratio | 0.663 | 1.879 | 0.664 |
While the gradual increase in leverage ratios is noted, Essex's improved Current Ratio suggests a bolstered liquidity situation, facilitating unforeseen industry dynamics.
📈 Fundamental Strength & Profitability
These measure profitability and efficiency, supporting a firm's operating prowess and shareholder value creation.
| Year | 2022 | 2023 | 2024 |
|---|---|---|---|
| Return on Equity | 7.14% | 7.48% | 13.39% |
| Margins: Net | 25.41% | 24.31% | 41.79% |
| EBIT Margin | 40.88% | 38.55% | 58.99% |
| EBITDA Margin | 74.44% | 71.41% | 91.69% |
| Research & Development/Revenue | 0% | 0% | 0% |
With impressive margin improvements, Essex's profitability trends reflect strategic operations, but continued evolution will necessitate constant financial prudence and innovative enhancements.
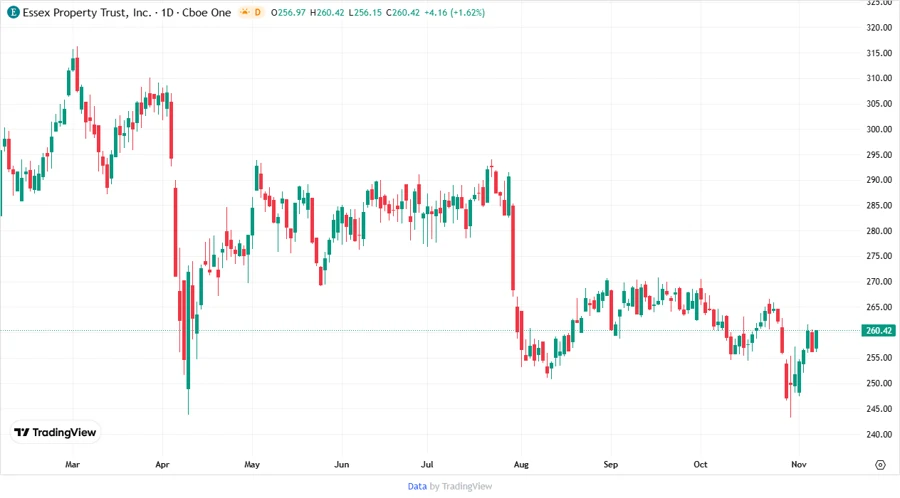
📉 Price Development
🔍 Dividend Scoring System
| Category | Score | Score Bar |
|---|---|---|
| Dividend Yield | 3 | |
| Dividend Stability | 4 | |
| Dividend Growth | 2 | |
| Payout Ratio | 3 | |
| Financial Stability | 4 | |
| Dividend Continuity | 4 | |
| Cashflow Coverage | 3 | |
| Balance Sheet Quality | 4 |
Overall Score: 27 out of 40
🗣️ Rating
Essex Property Trust, Inc. maintains a reputable presence in real estate investment, delivering a moderate dividend yield. Despite recent navigational challenges reflected in negative dividend growth and adjusted payouts, the firm's financial fundamentals and balance sheet suggest resilient operational capability. A cautious yet optimistic approach recommends holding positions while observing market dynamics and management strategies.
Smart Data Insight
Master the Perfect Entry & Exit for this Stock
Don't leave your profits to chance. Historically, this stock follows specific seasonal patterns that institutional traders use to maximize returns.
- ✅ Identify the "Golden Buying Window"
- ✅ Avoid high-risk correction cycles
- ✅ Backtested data from the last 20+ years