June 19, 2025 a 11:31 am

ESS: Dividend Analysis - Essex Property Trust, Inc.
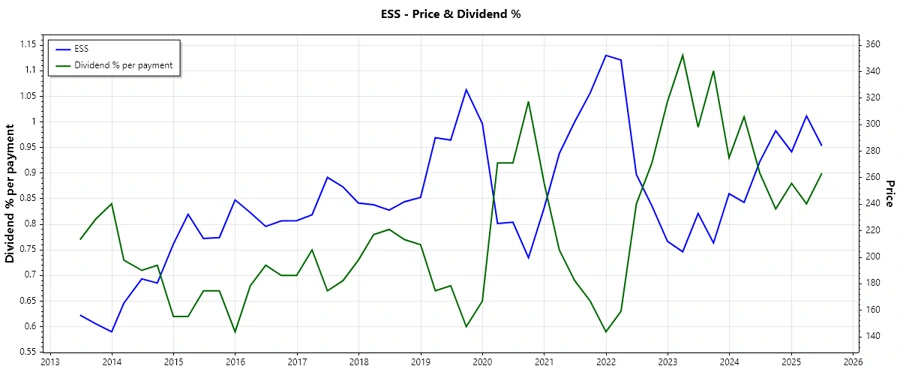
Essex Property Trust, Inc. has demonstrated a strong presence in the real estate sector with an impressive history of sustaining its dividend payments for the past 32 years. However, recent data indicates a decline in dividend growth over both the 3-year and 5-year periods, coupled with a high payout ratio relative to EPS and FCF. Investors should consider these metrics while acknowledging the solid dividend yield of 3.54%.
📊 Overview
The overview of Essex Property Trust, Inc. reflects its enduring performance as a dividend-paying entity within the real estate sector. The company's dividend yield of 3.54% is attractive, though the decline in dividend growth over recent years and the recent suspension in 2024 highlight uncertainty in sustaining future payouts.
| Attribute | Value |
|---|---|
| Sector | Real Estate |
| Dividend yield | 3.54% |
| Current dividend per share | 9.66 USD |
| Dividend history | 32 years |
| Last cut or suspension | 2024 |
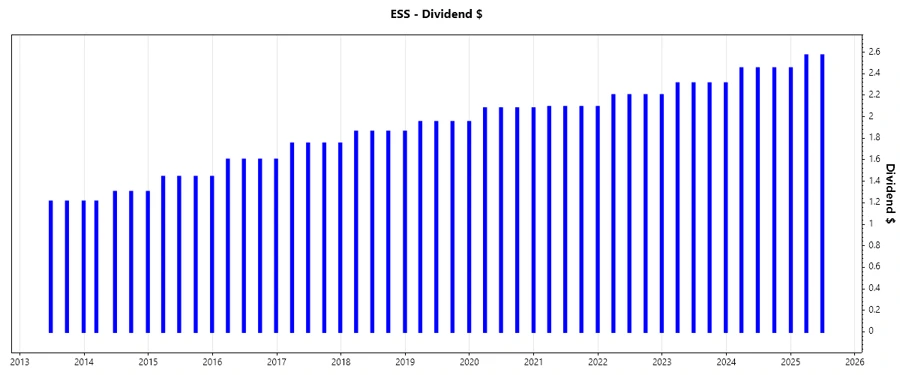
📉 Dividend History
Understanding the dividend history is crucial as it demonstrates the company's capability to reward its shareholders consistently. Even though the last dividend cut in 2024 raises concerns, Essex's long-standing history of 32 years with dividends adds confidence for long-term investors.
| Year | Dividend per Share (USD) |
|---|---|
| 2025 | 7.59 |
| 2024 | 7.35 |
| 2023 | 9.24 |
| 2022 | 8.80 |
| 2021 | 8.36 |
📈 Dividend Growth
The growth in dividends of a company signals its ability to increase shareholder returns over time. However, Essex has shown slight declines in dividend growth, at -0.04% over 3 years and -0.01% over 5 years, which may be reflective of operational challenges or broader market conditions.
| Time | Growth |
|---|---|
| 3 years | -0.04% |
| 5 years | -0.01% |
The average dividend growth is -0.01% over 5 years. This shows moderate but steady dividend growth.
✅ Payout Ratio
The payout ratio is a critical metric indicating the sustainability of dividend payments by a company. With an EPS-based payout ratio of 92.47% and a free cash flow-based payout ratio of 67.25%, Essex is paying a significant portion of its earnings as dividends, which could strain future growth initiatives.
| Key Figure | Ratio |
|---|---|
| EPS-based | 92.47% |
| Free cash flow-based | 67.25% |
The high payout ratios suggest reliance on current earnings for dividends, which might limit reinvestment potential.
💵 Cashflow & Capital Efficiency
Strong cash flow and capital efficiency are fundamental for sustaining dividend payments. Despite a robust free cash flow yield of 4.94%, the allocation toward capital expenditures shows prudent cash management.
| Year | 2024 | 2023 | 2022 |
|---|---|---|---|
| Free Cash Flow Yield | 5.08% | 5.27% | 5.89% |
| Earnings Yield | 4.04% | 2.55% | 2.96% |
| CAPEX to Operating Cash Flow | 12.77% | 14.32% | 16.73% |
| Stock-based Compensation to Revenue | 0.40% | 0% | 0.45% |
| Free Cash Flow / Operating Cash Flow Ratio | 87.23% | 85.68% | 83.27% |
Essex's stable free cash flow to operating cash flow ratio indicates good cash flow stability, which is crucial for maintaining dividends.
🗣️ Balance Sheet & Leverage Analysis
An analysis of leverage helps assess financial risk. Essex's debt ratios indicate a moderate level of leverage, important for debt servicing and financial stability.
| Year | 2024 | 2023 | 2022 |
|---|---|---|---|
| Debt-to-Equity | 1.20 | 1.16 | 1.05 |
| Debt-to-Assets | 51.47% | 50.73% | 48.71% |
| Debt-to-Capital | 54.58% | 53.63% | 51.32% |
| Net Debt to EBITDA | 4.56 | 3.94 | 5.31 |
| Current Ratio | 1.0 | 0.59 | 4.96 |
| Quick Ratio | 0.66 | 0.59 | 5.14 |
| Financial Leverage | 2.33 | 2.28 | 2.16 |
Despite the leverage, Essex's solid operating cash flow coverage ratio ensures its capability to manage debt effectively.
🧮 Fundamental Strength & Profitability
Profitability metrics like return on equity and assets signify operational efficiency. Despite a slight variation in margins year over year, Essex shows consistent profitability, critical for sustained dividends.
| Year | 2024 | 2023 | 2022 |
|---|---|---|---|
| Return on Equity | 13.39% | 7.48% | 7.14% |
| Return on Assets | 5.74% | 3.28% | 3.30% |
| Margins - Net | 41.79% | 24.31% | 25.41% |
| EBIT Margin | 58.99% | 56.50% | 58.51% |
| EBITDA Margin | 91.69% | 89.36% | 70.20% |
| Gross Margin | 68.00% | 68.14% | 68.39% |
| R&D to Revenue | 0% | 0% | 0.00% |
Essex's robust margins are indicative of its ability to maintain profitability amidst market fluctuations, lending credence to its operational resilience.
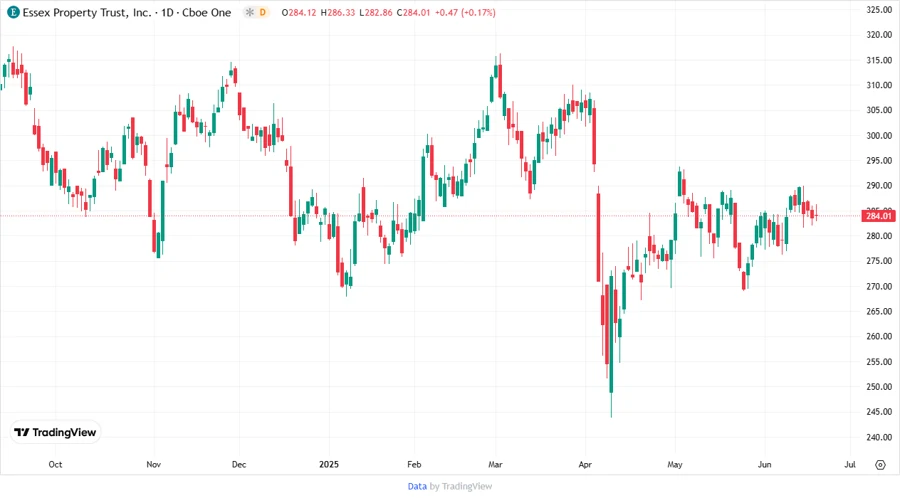
📊 Price Development
🏅 Dividend Scoring System
| Category | Score | |
|---|---|---|
| Dividend yield | 4 | |
| Dividend Stability | 3 | |
| Dividend growth | 2 | |
| Payout ratio | 3 | |
| Financial stability | 4 | |
| Dividend continuity | 3 | |
| Cashflow Coverage | 4 | |
| Balance Sheet Quality | 4 |
Overall Score: 27/40
📈 Rating
Considering the data, Essex Property Trust, Inc. maintains a strong position in the real estate market with a commendable dividend yield. However, high payout ratios and fluctuating dividend growth suggest cautious optimism. It remains a stable choice for dividend investors seeking moderate income in a growing sector.
Smart Data Insight
Master the Perfect Entry & Exit for this Stock
Don't leave your profits to chance. Historically, this stock follows specific seasonal patterns that institutional traders use to maximize returns.
- ✅ Identify the "Golden Buying Window"
- ✅ Avoid high-risk correction cycles
- ✅ Backtested data from the last 20+ years