May 14, 2026 a 02:03 pm
ERIE: Trend and Support & Resistance Analysis - Erie Indemnity Company
The Erie Indemnity Company has been a steady performer in the financial sector, providing essential services to Erie Insurance Exchange subscribers. Known for their robust business model, Erie navigates market challenges through strategic service offerings and a commitment to customer satisfaction. Despite recent fluctuations in the stock price, the company's fundamentals remain solid. Investors are advised to keep an eye on emerging trends and potential market shifts that could influence the company's stock performance.
Trend Analysis
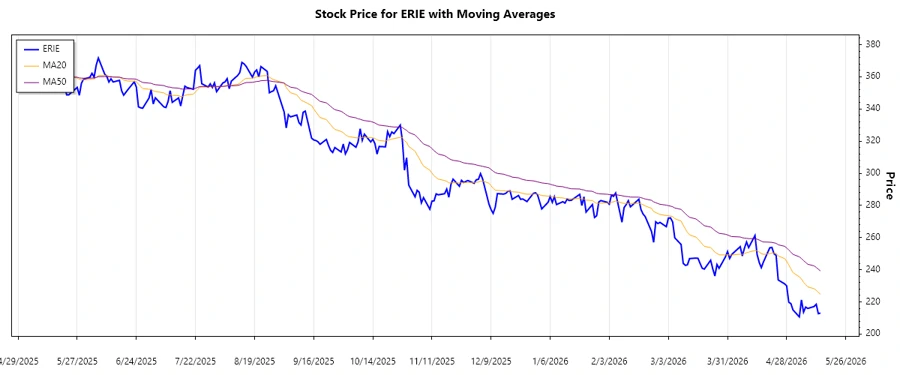
Observing the stock prices for Erie Indemnity Company over the recent months highlights a prevailing downward trend. This is confirmed by calculating the 20-day and 50-day Exponential Moving Averages (EMAs). The EMA20 is currently below the EMA50, indicating a bearish sentiment in the market.
| Date | Close Price | Trend |
|---|---|---|
| 2026-05-14 | 213.01 | ▼ |
| 2026-05-13 | 212.66 | ▼ |
| 2026-05-12 | 218.50 | ▼ |
| 2026-05-11 | 217.09 | ▼ |
| 2026-05-08 | 215.90 | ▼ |
| 2026-05-07 | 216.75 | ▼ |
| 2026-05-06 | 213.56 | ▼ |
This consistent downward trend suggests that investors should be cautious when making decisions, as market sentiment is currently bearish. The overall decline can serve as an indication of potential volatility and market corrections.
Support and Resistance
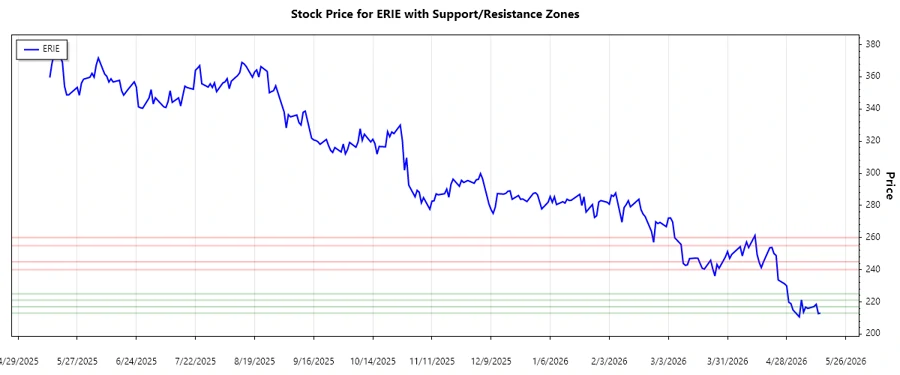
Identifying support and resistance levels is critical in determining potential market movements. Based on the recent stock data, several key zones have been identified. These zones act as significant markers for potential price reversals, acting as either a floor (support) or ceiling (resistance) for stock prices.
| Zone Type | From | To |
|---|---|---|
| Support | 213.00 | 217.00 |
| Support | 221.00 | 225.00 |
| Resistance | 240.00 | 245.00 |
| Resistance | 255.00 | 260.00 |
Currently, Erie's stock price is positioned near the lower support zone, posing a potential risk for further bearish developments. Breaking below this support could signal further declines, while a bounce back might indicate a stabilization.
Conclusion
Erie Indemnity Company is facing a challenging period marked by a definitive downward trend amidst bearish market conditions. The identified support and resistance zones provide critical insights for technical analysts, presenting potential opportunities for investment or risk management. Given the current position near support levels, investors should closely monitor fundamental and market developments that could influence future trends. A break below support levels could lead to further decreases, while a stabilization could indicate a recovery. As always, it's crucial to balance these technical insights with broader economic indicators and company-specific news to make informed decisions.
json This HTML and JSON data provide structured information for both textual analysis and programmatic processing.
Smart Data Insight
Master the Perfect Entry & Exit for this Stock
Don't leave your profits to chance. Historically, this stock follows specific seasonal patterns that institutional traders use to maximize returns.
- ✅ Identify the "Golden Buying Window"
- ✅ Avoid high-risk correction cycles
- ✅ Backtested data from the last 20+ years