November 18, 2025 a 01:15 pm


ERIE: Trend and Support & Resistance Analysis - Erie Indemnity Company
Erie Indemnity Company provides vital services for policyholders of the Erie Insurance Exchange. The company's operation, based heavily on efficient sales, underwriting, and technological support, reveals robust foundational stability. Recent stock performance offers crucial insights into its operational valuation. Herein, we analyze the latest trending patterns and pinpoint significant support and resistance levels to gauge future movements.
Trend Analysis
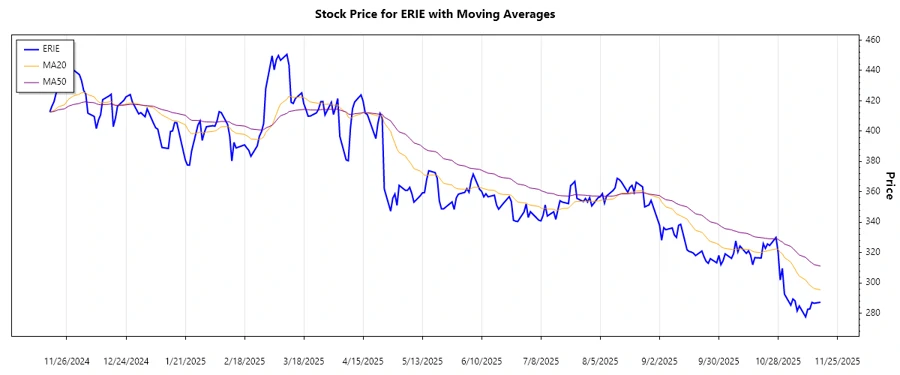
The analysis of Erie Indemnity's stock over the past months shows varied trends with periodic fluctuations. To ascertain the current trend, we calculate the exponential moving averages (EMA) over 20 and 50 days, focusing on identifying a dominant trend.
| Date | Close Price | Trend |
|---|---|---|
| 2025-11-17 | 287.28 | ▼ |
| 2025-11-14 | 286.58 | ▼ |
| 2025-11-13 | 287.18 | ▼ |
| 2025-11-12 | 282.84 | ▼ |
| 2025-11-11 | 282.66 | ▼ |
| 2025-11-10 | 277.63 | ▼ |
| 2025-11-07 | 284.84 | ▼ |
The current movement reflects a persistent downward trajectory, with the EMA20 consistently undercrossing the EMA50. This indicates a prevalent bearish sentiment.
Support and Resistance
Identifying support and resistance zones is pivotal for understanding potential reversal points in the stock's price movement.
| Zone Type | From | To |
|---|---|---|
| Support Zone 1 | 275.00 | 280.00 |
| Support Zone 2 | 270.00 | 275.00 |
| Resistance Zone 1 | 292.00 | 295.00 |
| Resistance Zone 2 | 300.00 | 310.00 |
Currently, the stock price resides within the first support zone, indicating a critical potential bounce-back point. However, vigilance is required for a break below, which may further exacerbate downtrends.
Conclusion
Erie Indemnity Company's stock presently exhibits vulnerable bearish tendencies, with prevalent risks associated with the current downtrend. Nonetheless, support zones afford critical intervention points that may avert further declines. Strategic long-term conviction positions could potentially capitalize on subsequent reversals.
Smart Data Insight
Master the Perfect Entry & Exit for this Stock
Don't leave your profits to chance. Historically, this stock follows specific seasonal patterns that institutional traders use to maximize returns.
- ✅ Identify the "Golden Buying Window"
- ✅ Avoid high-risk correction cycles
- ✅ Backtested data from the last 20+ years