October 18, 2025 a 04:03 am

ERIE: Trend and Support & Resistance Analysis - Erie Indemnity Company
Erie Indemnity Company, acting as a managing attorney-in-fact for the Erie Insurance Exchange, has shown varied price movements in recent months. Analyzing the historical data reveals potential key trends and critical support and resistance zones. Understanding these market dynamics is essential for making informed investment decisions.
Trend Analysis
| Date | Closing Price | Trend |
|---|---|---|
| 2025-10-17 | $316.66 | ▼ |
| 2025-10-16 | $311.93 | ▼ |
| 2025-10-15 | $318.40 | ▼ |
| 2025-10-14 | $321.14 | ▲ |
| 2025-10-13 | $319.47 | ▲ |
| 2025-10-10 | $324.31 | ▲ |
| 2025-10-09 | $320.45 | ⚖️ |
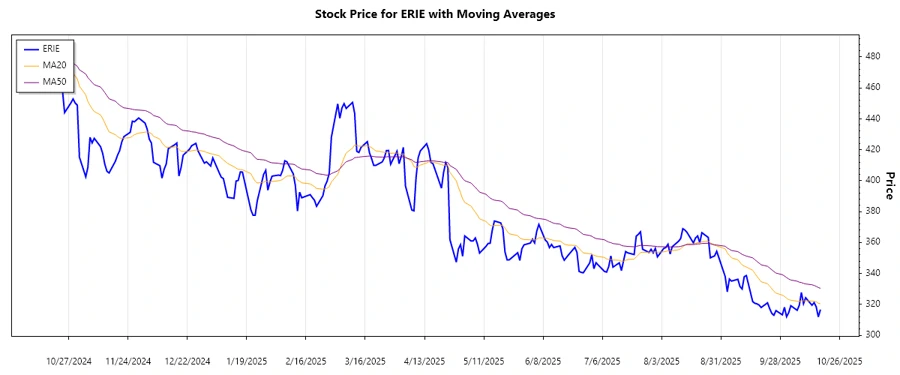
Based on the EMA calculations, the recent data indicates a mix of trends with alternating days of upward and downward movement. The overall sentiment appears cautious.
Support and Resistance Analysis
| Zone Type | From | To | Trend |
|---|---|---|---|
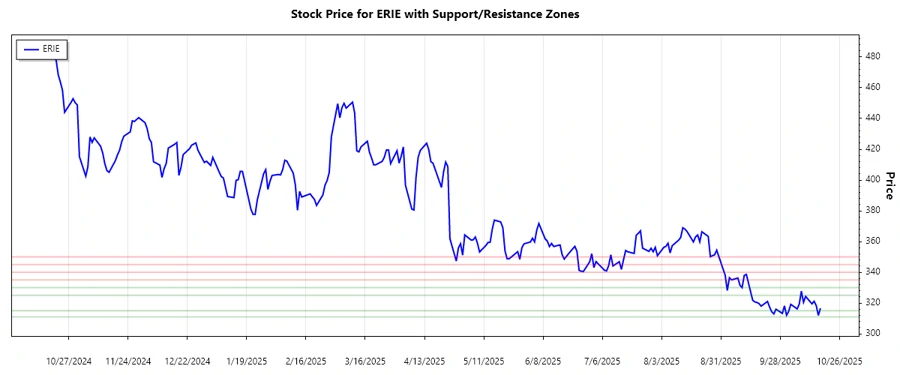
| Support | $311.00 | $315.00 | ▼ |
| Support | $325.00 | $330.00 | ▼ |
| Resistance | $335.00 | $340.00 | ▲ |
| Resistance | $345.00 | $350.00 | ▲ |
The current price is approaching a support zone, suggesting a possible stabilizing action. Investors should monitor for a breakthrough in either direction.
Conclusion
The Erie Indemnity Company's stock exhibits potential volatility with recent decreases suggesting caution among investors. The approaching support levels may offer stabilization, but the lack of a dominant trend highlights potential risks. With calculated risks, strategic decisions could capture any upside potential while remaining watchful for price dips. Close monitoring of market conditions and fundamental factors remains imperative for stakeholders.
Smart Data Insight
Master the Perfect Entry & Exit for this Stock
Don't leave your profits to chance. Historically, this stock follows specific seasonal patterns that institutional traders use to maximize returns.
- ✅ Identify the "Golden Buying Window"
- ✅ Avoid high-risk correction cycles
- ✅ Backtested data from the last 20+ years