
June 01, 2026 a 08:00 am

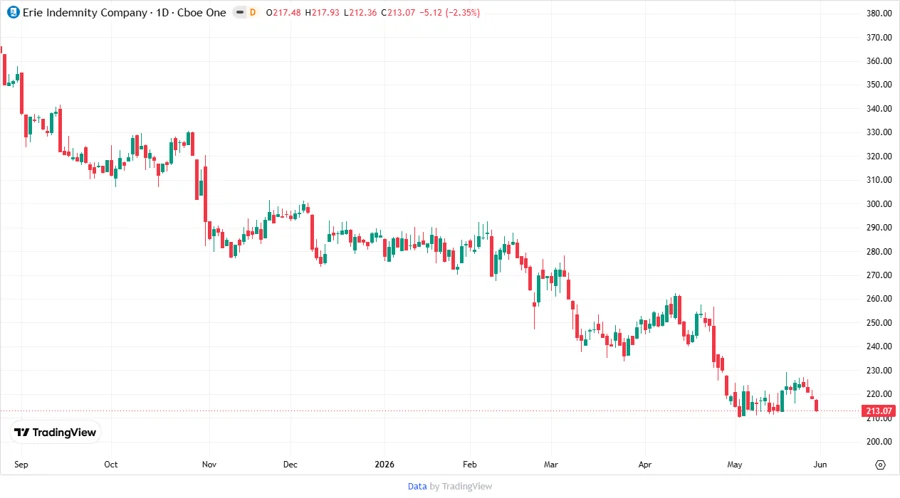
ERIE: Fundamental Ratio Analysis - Erie Indemnity Company
Erie Indemnity Company, operating as a managing attorney-in-fact, offers extensive services for policyholders within the Erie Insurance Exchange. With strong fundamentals and a long-standing presence in the insurance sector, the company's stock appears stable. However, the inherent complexities of the insurance market and regulatory changes could pose potential challenges.
Fundamental Rating
Erie Indemnity has an overall rating of B+, with scores reflecting varying strengths across fundamental metrics.
| Category | Score | Visualization |
|---|---|---|
| Overall | 3 | |
| Discounted Cash Flow | 5 | |
| Return on Equity | 5 | |
| Return on Assets | 5 | |
| Debt to Equity | 1 | |
| Price to Earnings | 2 | |
| Price to Book | 1 |
Historical Rating
Review the historical scores to gauge the consistency or variability in financial performance over time.
| Date | Overall | DCF | ROE | ROA | Debt/Equity | P/E | P/B |
|---|---|---|---|---|---|---|---|
| 2026-05-28 | 3 | 5 | 5 | 5 | 1 | 2 | 1 |
| N/A | 0 | 5 | 5 | 5 | 1 | 2 | 1 |
Analysts' Price Targets
Due to limited recent coverage, price target data is absent, indicating potential undervaluation or lack of major analyst focus.
| High | Low | Median | Consensus |
|---|---|---|---|
| 0 | 0 | 0 | 0 |
Analysts Sentiment
The lack of recent analyst ratings might suggest a stable outlook, but vigilance is essential for any emerging trends.
| Recommendation | Count | Visualization |
|---|---|---|
| Strong Buy | 0 | |
| Buy | 0 | |
| Hold | 0 | |
| Sell | 0 | |
| Strong Sell | 0 |
Conclusion
Erie Indemnity Company displays strong fundamentals, particularly in cash flow and return metrics, suggesting a solid financial base. However, the low scores in valuation ratios could highlight market inefficiencies or growth concerns. Limited analyst activity may indicate stability or overlooked growth potential. Investors should weigh the company's established market position against potential disruptions in the insurance sector.
Smart Data Insight
Master the Perfect Entry & Exit for this Stock
Don't leave your profits to chance. Historically, this stock follows specific seasonal patterns that institutional traders use to maximize returns.
- ✅ Identify the "Golden Buying Window"
- ✅ Avoid high-risk correction cycles
- ✅ Backtested data from the last 20+ years