
July 22, 2026 a 03:15 pm
ERIE: Fibonacci Analysis - Erie Indemnity Company
The Erie Indemnity Company has shown volatility in its recent trading patterns. Supported by a solid business model, it has managed to maintain a stable financial position amid market fluctuations. Investors should pay attention to technical indicators such as Fibonacci retracement levels to gauge potential future price movements.
Fibonacci Analysis
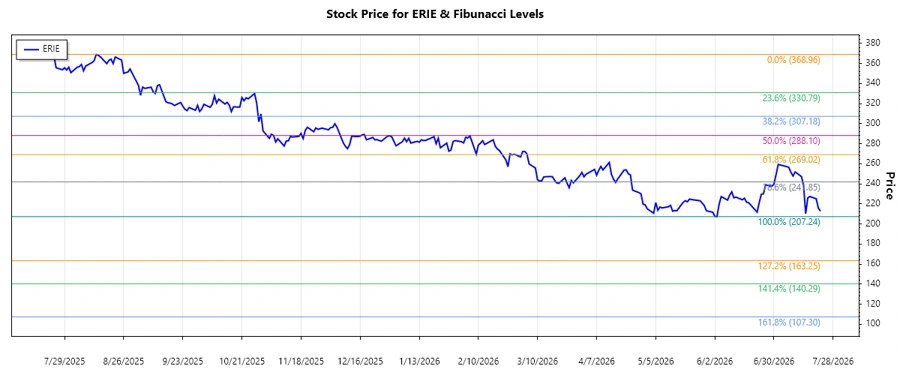
The analysis of Erie Indemnity Company's recent stock performance reveals a dominant downtrend from December 2025 to late July 2026. This period saw the stock price peak at $368.96 on 13 August 2025, before plummeting to a low of $207.24 on 3 June 2026.
| Start Date | End Date | High Point (Price & Date) | Low Point (Price & Date) |
|---|---|---|---|
| 2025-12-05 | 2026-07-22 | $368.96 on 2025-08-13 | $207.24 on 2026-06-03 |
| Fibonacci Level | Price Level |
|---|---|
| 0.236 | $243.63 |
| 0.382 | $266.20 |
| 0.5 | $288.10 |
| 0.618 | $309.99 |
| 0.786 | $338.74 |
The current stock price of $212.65, as of July 22, 2026, does not fall within the retracement zones, indicating that any upward corrections have yet to test significant Fibonacci resistance levels.
In conclusion, this suggests the possibility of further decline towards past low levels unless a robust support at $243.63 is reached and sustained, which could signal a rebound potential.
Chart of Erie Indemnity Company's recent price action.
Conclusion
The Erie Indemnity Company's stock has experienced a notable downtrend over the highlighted period. Despite this decline, there are chances of potential recovery if the stock manages to sustain above critical Fibonacci levels. Caution is advised due to existing volatility and broader market conditions. Technical indicators, along with fundamental analysis, should guide future investment decisions, keeping in mind the potential for both short-term trading opportunities and long-term value. This analysis could help investors identify if ERIE finds support in upcoming trading sessions or if further strategic adjustments are needed.
Smart Data Insight
Master the Perfect Entry & Exit for this Stock
Don't leave your profits to chance. Historically, this stock follows specific seasonal patterns that institutional traders use to maximize returns.
- ✅ Identify the "Golden Buying Window"
- ✅ Avoid high-risk correction cycles
- ✅ Backtested data from the last 20+ years