September 09, 2025 a 11:44 am
ERIE: Fibonacci Analysis - Erie Indemnity Company
The Erie Indemnity Company has shown varied stock performance, reflecting its strong operational role as a managing attorney-in-fact for subscribers at the Erie Insurance Exchange. Their services in underwriting, policy processing, and customer service have sustained them in a competitive market. The analysis highlights a recent downtrend, emphasizing the importance of strategic market positioning.
Fibonacci Analysis
| Analysis Component | Details |
|---|---|
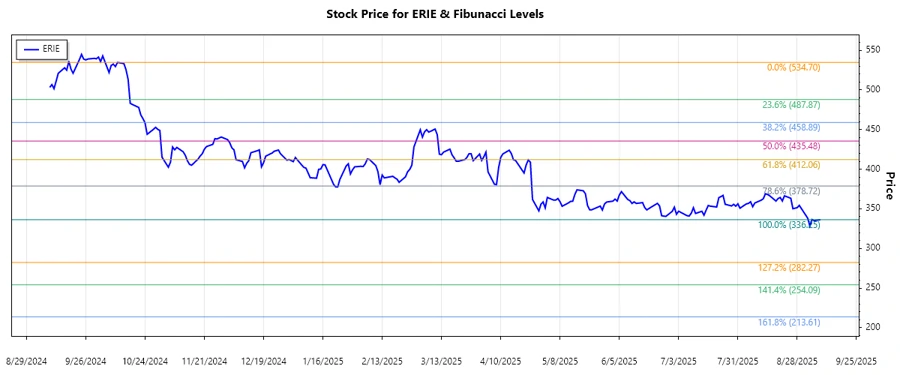
| Trend Start Date | 2024-10-11 |
| Trend End Date | 2025-09-08 |
| High Price and Date | $534.70 on 2024-10-11 |
| Low Price and Date | $336.25 on 2025-09-08 |
| Fibonacci Levels |
|
| Current Price Scenario | The current price is in a retracement zone near 0.236. |
| Technical Interpretation | The 0.236 level could serve as a potential support, indicating a possible reversal or consolidation phase. |
Conclusion
Erie Indemnity has experienced a significant downward correction from its high, aligning with broader market trends. The current positioning near the 0.236 Fibonacci level may indicate a pause or reversal, contingent on broader economic conditions. While this could present a buying opportunity, risks remain given potential market volatility. Analysts might observe for stronger support levels or bullish momentum before confirming an upward trend.
Smart Data Insight
Master the Perfect Entry & Exit for this Stock
Don't leave your profits to chance. Historically, this stock follows specific seasonal patterns that institutional traders use to maximize returns.
- ✅ Identify the "Golden Buying Window"
- ✅ Avoid high-risk correction cycles
- ✅ Backtested data from the last 20+ years