April 26, 2026 a 12:46 pm

ERIE: Dividend Analysis - Erie Indemnity Company
Erie Indemnity Company stands out with a robust dividend history of 32 years, indicating a strong commitment to returning value to shareholders. This analysis evaluates ERIE's dividend yield, growth, and stability, offering insights into its financial health and future dividend potential. Despite recent fluctuations, the company's balance sheet strength and steady payout ratios contribute to a reliable investment profile.
Overview 📊
Erie Indemnity operates in a sector known for its stable returns, offering a current dividend yield of 2.46%. This is complemented by a dividend per share of $5.46, showcasing a strong capacity to generate shareholder returns consistently. With a dividend history of over three decades, it remains a priority for ERIE to maintain its record, having not cut or suspended dividends in the recent past.
| Attribute | Value |
|---|---|
| Sector | Insurance |
| Dividend yield | 2.46% |
| Current dividend per share | $5.46 |
| Dividend history | 32 years |
| Last cut or suspension | None |
Dividend History 🗣️
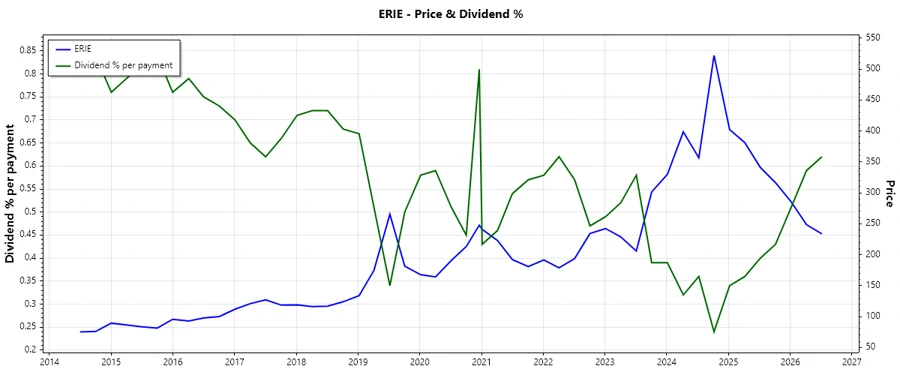
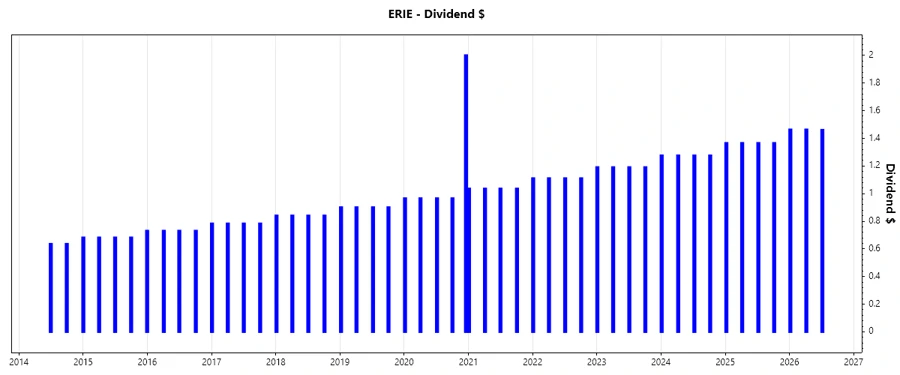
With a dividend history spanning 32 years, Erie Indemnity has demonstrated a strong commitment to shareholder returns. This is vital as it undermines investor confidence and promotes long-term investment. Historical performance often provides a proxy for future possibilities, although it is crucial to watch for any financial distress signs that could impact this pattern.
| Year | Dividend per Share (USD) |
|---|---|
| 2026 | 4.385 |
| 2025 | 5.460 |
| 2024 | 5.100 |
| 2023 | 4.76 |
| 2022 | 4.44 |
Dividend Growth 📈
The dividend growth rate is a critical factor in assessing the potential for future income increases. Erie Indemnity has faced challenges with growth, featuring a three-year growth rate of 0.07% and a concerning five-year rate of -1.40%. While these figures illustrate stagnation and a lack of upward momentum, the underlying fundamentals remain strong, suggesting opportunities for growth in a supportive financial climate.
| Time | Growth |
|---|---|
| 3 years | 0.07% |
| 5 years | -1.40% |
The average dividend growth is -1.40% over 5 years. This indicates a lack of improvement, yet the potential for consistent dividends remains due to the enduring financial robustness of the company.
Payout Ratio 📉
Payout ratios are pivotal to assessing dividend sustainability. Erie Indemnity maintains an EPS-based payout ratio of 44.5% and a free cash flow-based figure of 46.96%. These levels suggest a balanced approach to reinvestment and distribution, ensuring financial growth without overextending the company's resources. Investors can look upon these ratios as indicators of dividend reliability.
| Key Figure | Ratio |
|---|---|
| EPS-based | 44.50% |
| Free cash flow-based | 46.96% |
The EPS payout ratio of 44.5% indicates a healthy distribution strategy, while the free cash flow ratio of 46.96% underscores the company’s capacity to maintain its dividend payouts without compromising its operational funding.
Cashflow & Capital Efficiency ✅
Analyzing cash flow efficiency is essential to understanding Erie Indemnity's operational effectiveness and financial management. Metrics such as Free Cash Flow Yield and CAPEX to Operating Cash prove critical, indicating the firm’s financial flexibility and investment optimization. Consistent cash flow underpins robust dividend coverage, providing added assurance to stakeholders.
| 2025 | 2024 | 2023 | |
| Free Cash Flow Yield | 4.28% | 2.55% | 1.87% |
| Earnings Yield | 4.19% | 3.15% | 2.88% |
| CAPEX to Operating Cash Flow | 16.85% | 20.42% | 24.30% |
| Stock-based Compensation to Revenue | -2.33% | 0% | 0% |
| Free Cash Flow / Operating Cash Flow Ratio | 83.15% | 79.57% | 75.70% |
Overall, these cash flow metrics highlight Erie Indemnity’s capital management effectiveness, ensuring a stable backdrop for its dividend policy by assuring adequate free cash flow generation relative to its operational cash flow.
Balance Sheet & Leverage Analysis ⚠️
Assessing balance sheet ratios provides insight into Erie Indemnity’s financial robustness and leverage structure. Critical indicators like Debt-to-Equity and Net Debt to EBITDA highlight its capacity to honor obligations in various financial states, while liquidity metrics like Current Ratio give insight into cash flow soundness to meet short-term liabilities.
| 2025 | 2024 | 2023 | |
| Debt-to-Equity | 0% | 0.38% | 0% |
| Debt-to-Assets | 0% | 0.26% | 0% |
| Debt-to-Capital | 0% | 0.38% | 0% |
| Net Debt to EBITDA | -43.93% | -34.88% | -24.00% |
| Current Ratio | 0 | 142.68% | 131.20% |
| Quick Ratio | 126.82% | 142.68% | 131.20% |
| Financial Leverage | 1.470 | 1.454 | 1.487 |
The balance sheet's metrics convey a solid picture of Erie Indemnity’s financial health, maximizing equity to ensure resilience, liquidity, and capacity to cover obligations while keeping debt burdens minimal.
Fundamental Strength & Profitability 🏆
The financial metrics of ERIE reveal a consistently profitable enterprise, with high Returns on Equity and Assets, underlining efficient use of shareholder investments. Margin insights into Net Profit, EBIT, and EBITDA provide clarity on operational efficiency and profitability, ensuring a robust foundation for future dividend increments.
| 2025 | 2024 | 2023 | |
| Return on Equity | 24.50% | 30.21% | 26.83% |
| Return on Assets | 16.67% | 20.78% | 18.04% |
| Margins: Net | 13.75% | 15.82% | 13.65% |
| Margins: EBIT | 17.47% | 18.70% | 16.91% |
| Margins: EBITDA | 19.36% | 20.19% | 18.36% |
| Margins: Gross | 15.76% | 17.82% | 15.92% |
| R&D to Revenue | 0% | 0% | 0% |
These ratios and margins underscore solid profitability and investment efficiency, ensuring a favorable standpoint for leveraging operational capabilities into tangible shareholder advantages, such as dividends.
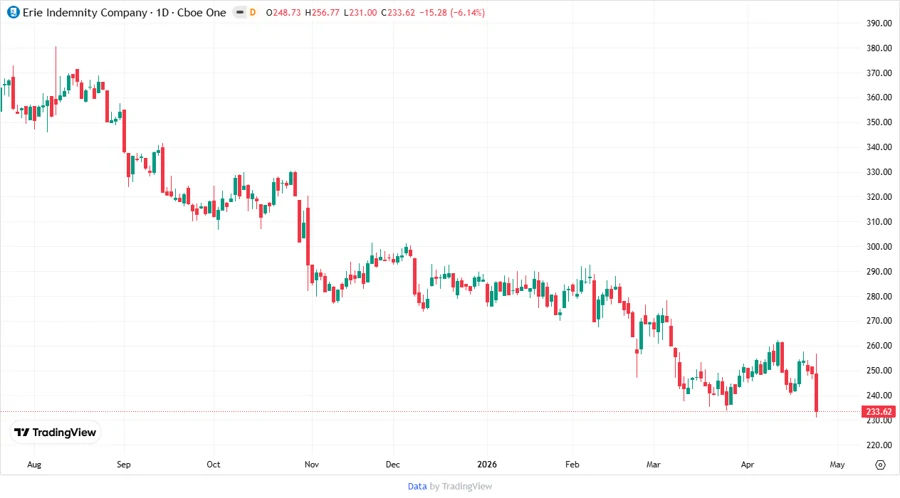
Price Development 💹
Dividend Scoring System 🔍
| Criteria | Score | Graphical |
|---|---|---|
| Dividend yield | 3 | |
| Dividend Stability | 5 | |
| Dividend growth | 2 | |
| Payout ratio | 4 | |
| Financial stability | 5 | |
| Dividend continuity | 5 | |
| Cashflow Coverage | 4 | |
| Balance Sheet Quality | 5 |
Total Score: 33/40
Rating 🎯
Erie Indemnity Company presents a robust and reliable dividend investment opportunity, characterized by sound financial management, excellent dividend continuity, and strong balance sheet fundamentals. While the short-term dividend growth features minor setbacks, stability and capacity for consistent payments make it a strong candidate for income-focused investors. As per the scoring system, ERIE garners a favorable rating, recommending it as a dependable inclusion within diversified dividend portfolios.
Smart Data Insight
Master the Perfect Entry & Exit for this Stock
Don't leave your profits to chance. Historically, this stock follows specific seasonal patterns that institutional traders use to maximize returns.
- ✅ Identify the "Golden Buying Window"
- ✅ Avoid high-risk correction cycles
- ✅ Backtested data from the last 20+ years