November 07, 2025 a 11:32 am

ERIE: Dividend Analysis - Erie Indemnity Company
Erie Indemnity Company demonstrates a robust dividend history with a consistent yield. Despite economic challenges, it has maintained a notable dividend growth over the years. The company's financial health is underlined by its sensible payout ratios, indicating strong cash flow coverage and prudent financial management.
📊 Overview
The following table provides a comprehensive look at Erie Indemnity Company's dividend profile and sector placement:
| Specification | Data |
|---|---|
| Sector | Financial |
| Dividend yield | 1.73% |
| Current dividend per share | 5.14 USD |
| Dividend history | 31 years |
| Last cut or suspension | 2021 |
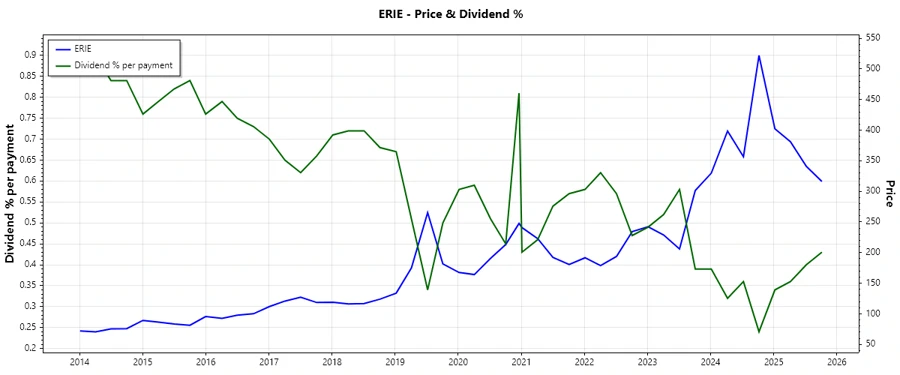
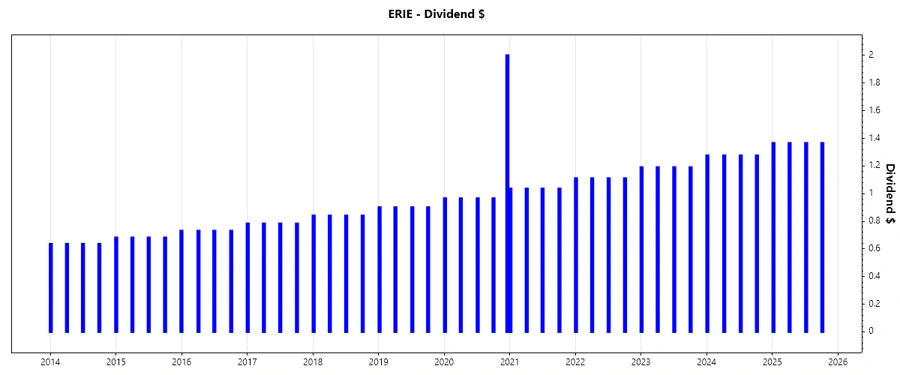
📈 Dividend History
A strong track record of dividend payments indicates a company's commitment to returning value to shareholders. Erie Indemnity has demonstrated reliability in its dividend disbursement over the years, which can instill investor confidence.
| Year | Dividend per Share (USD) |
|---|---|
| 2025 | 5.460 |
| 2024 | 5.100 |
| 2023 | 4.760 |
| 2022 | 4.440 |
| 2021 | 4.140 |
🏦 Dividend Growth
Dividend growth is a crucial factor for long-term investors. Erie Indemnity's commitment to increasing dividends reflects its strong earnings growth and ability to generate free cash flow.
| Time | Growth |
|---|---|
| 3 years | 7.20% |
| 5 years | 7.21% |
The average dividend growth is 7.21% over 5 years. This shows moderate but steady dividend growth.
💼 Payout Ratio
Payout ratios are key indicators of the sustainability of a company's dividend. A low payout ratio often suggests the dividend is secure and has room to grow.
| Key figure | Ratio |
|---|---|
| EPS-based | 37% |
| Free cash flow-based | 41% |
With an EPS payout ratio of 37% and a FCF payout ratio of 41%, Erie Indemnity maintains a balanced and sustainable dividend policy.
🔍 Cashflow & Capital Efficiency
This section illustrates Erie Indemnity's capacity to generate cash and its ability to efficiently utilize capital for sustainable growth.
| Metric | 2024 | 2023 | 2022 |
|---|---|---|---|
| Free Cash Flow Yield | 2.55% | 1.87% | 2.60% |
| Earnings Yield | 3.15% | 2.88% | 2.60% |
| CAPEX to Operating Cash Flow | 20.42% | 24.30% | 18.35% |
| Stock-based Compensation to Revenue | 0% | 0% | 0% |
| Free Cash Flow / Operating Cash Flow Ratio | 79.58% | 75.70% | 81.64% |
Erie Indemnity shows a healthy cash flow sustainability and efficiency with its capital, ensuring long-term financial stability.
📋 Balance Sheet & Leverage Analysis
A strong balance sheet reflects the ability of a company to withstand economic downturns. Leverage ratios provide insights into the company's solvency and overall financial health.
| Metric | 2024 | 2023 | 2022 |
|---|---|---|---|
| Debt-to-Equity | 0.38% | 6.75% | 8.46% |
| Debt-to-Assets | 0.26% | 4.54% | 5.47% |
| Debt-to-Capital | 0.38% | 6.32% | 7.80% |
| Net Debt to EBITDA | N/A | N/A | N/A |
| Current Ratio | 1.67 | 1.31 | 1.10 |
| Quick Ratio | 1.43 | 1.31 | 1.11 |
| Financial Leverage | 1.45 | 1.49 | 1.55 |
Erie Indemnity's low leverage ratios and strong liquidity indicate excellent financial health.
💡 Fundamental Strength & Profitability
Profit margins and returns determine a company's ability to operate efficiently and grow sustainably over the long term.
| Metric | 2024 | 2023 | 2022 |
|---|---|---|---|
| Return on Equity | 30.21% | 26.83% | 20.61% |
| Return on Assets | 20.78% | 18.04% | 13.33% |
| Margins: Net | 15.82% | 13.65% | 10.47% |
| Margins: EBIT | 19.95% | 15.74% | 13.27% |
| Margins: EBITDA | 21.64% | 17.38% | 15.09% |
| Margins: Gross | 17.82% | 17.15% | 13.58% |
| R&D to Revenue | 0% | 0% | 0% |
Erie Indemnity's robust profitability and return metrics showcase strong operational performance.
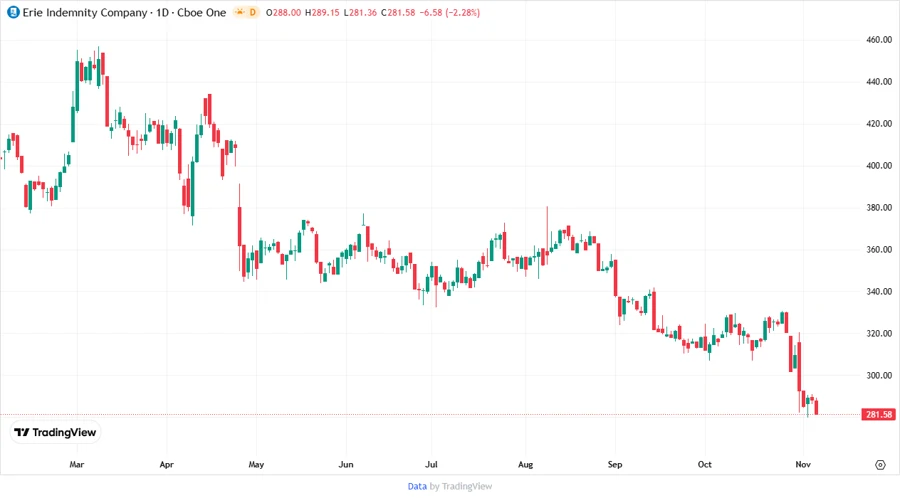
📉 Price Development
🗣️ Dividend Scoring System
| Criterion | Score | Score Bar |
|---|---|---|
| Dividend yield | 2 | |
| Dividend Stability | 4 | |
| Dividend growth | 4 | |
| Payout ratio | 5 | |
| Financial stability | 5 | |
| Dividend continuity | 5 | |
| Cashflow Coverage | 4 | |
| Balance Sheet Quality | 5 |
Overall Score: 34/40
✅ Rating
Erie Indemnity Company presents a strong dividend profile with consistent growth and solid financials. The prudent management of payout ratios and robust cash flow indicate reliable dividend sustainability, making it a compelling choice for dividend-focused investors.
Smart Data Insight
Master the Perfect Entry & Exit for this Stock
Don't leave your profits to chance. Historically, this stock follows specific seasonal patterns that institutional traders use to maximize returns.
- ✅ Identify the "Golden Buying Window"
- ✅ Avoid high-risk correction cycles
- ✅ Backtested data from the last 20+ years