May 02, 2026 a 03:15 am
EQR: Trend and Support & Resistance Analysis - Equity Residential
Equity Residential, a key player in the residential property management sector, exhibits significant potential for long-term growth given its strategic location in vibrant metropolitan areas. Recent price movements show fluctuations that could indicate emerging trends in the market. This analysis will explore the technical indicators to assess potential opportunities and risks for investors.
Trend Analysis
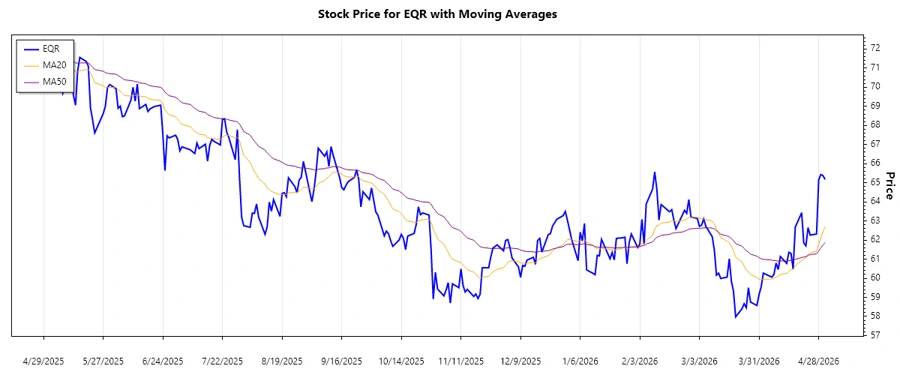
The recent performance of Equity Residential (EQR) shows varying momentum over the analyzed period, with the current trend indicating a potential shift.
| Date | Closing Price | Trend |
|---|---|---|
| 2026-05-01 | 65.17 | ▲ |
| 2026-04-30 | 65.38 | ▲ |
| 2026-04-29 | 65.43 | ▲ |
| 2026-04-28 | 65.15 | ▼ |
| 2026-04-27 | 62.32 | ▼ |
| 2026-04-24 | 62.26 | ▲ |
| 2026-04-23 | 62.65 | ▲ |
The EMA20 and EMA50 indicate a potential uptrend as EMA20 has crossed above EMA50.
Support and Resistance
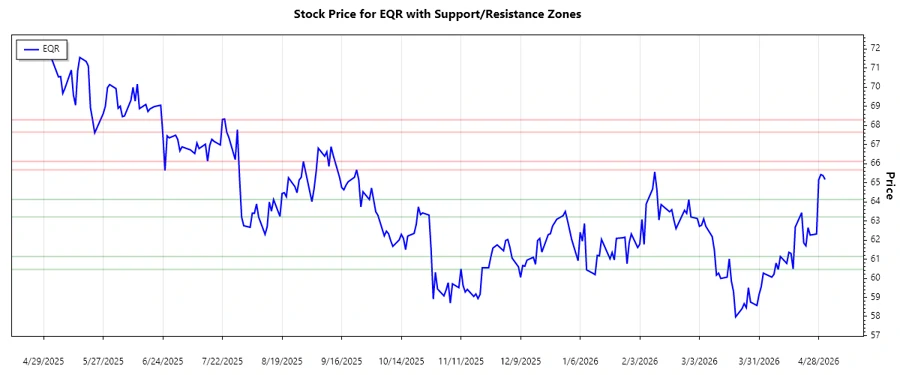
Analyzing the price data for Equity Residential, the following support and resistance zones are identified:
| Type | From | To | |
|---|---|---|---|
| Support Zone 1 | 60.46 | 61.14 | ▼ |
| Support Zone 2 | 63.21 | 64.12 | ▼ |
| Resistance Zone 1 | 65.68 | 66.12 | ▲ |
| Resistance Zone 2 | 67.65 | 68.30 | ▲ |
The current price is within the second resistance zone, suggesting a crucial point for trend continuation or reversal.
Conclusion
The EQR stock currently shows positive momentum, given its position in the identified resistance zone. The crossing of EMA20 above EMA50 points to a bullish outlook, although investors should be cautious about possible reversals at resistance levels. A successful breakout above the resistance could enable further gains, while failure might signal a pullback to support levels. Close monitoring of market conditions and potential economic factors impacting the real estate market is advised. Overall, EQR offers a balanced view of potential rewards and associated risks. Analyst attention should be focused on upcoming movements relative to the support and resistance zones.
Smart Data Insight
Master the Perfect Entry & Exit for this Stock
Don't leave your profits to chance. Historically, this stock follows specific seasonal patterns that institutional traders use to maximize returns.
- ✅ Identify the "Golden Buying Window"
- ✅ Avoid high-risk correction cycles
- ✅ Backtested data from the last 20+ years