February 09, 2026 a 01:15 pm
EQR: Trend and Support & Resistance Analysis - Equity Residential
Equity Residential is a leading real estate investment trust that focuses on the acquisition, development, and management of high-quality residential properties in major U.S. cities. Recently, its stock performance has shown signs of volatility, with a mix of bullish and bearish movements. The technical analysis indicates potential areas of support and resistance, guiding investors on strategic entry and exit points.
Trend Analysis
| Date | Close Price | Trend |
|---|---|---|
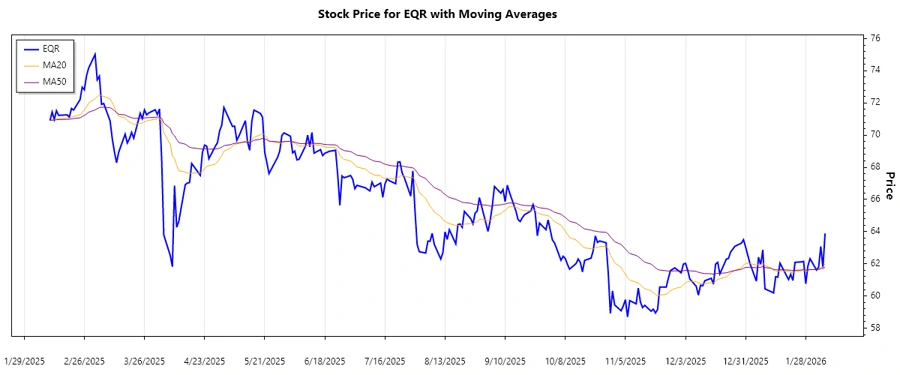
| 2026-02-06 | 63.89 | ▲ Uptrend |
| 2026-02-05 | 61.77 | ▼ Downtrend |
| 2026-02-04 | 63.08 | ▲ Uptrend |
| 2026-02-03 | 61.79 | ▼ Downtrend |
| 2026-02-02 | 61.61 | ⚖️ Neutral |
| 2026-01-30 | 62.32 | ⚖️ Neutral |
| 2026-01-29 | 61.86 | ▼ Downtrend |
Based on the calculated EMAs, the trend for EQR is predominantly neutral with intermittent up and down swings. Currently, there isn't a clear sustained movement in either direction.
Support and Resistance
| Zone Type | Start | End |
|---|---|---|
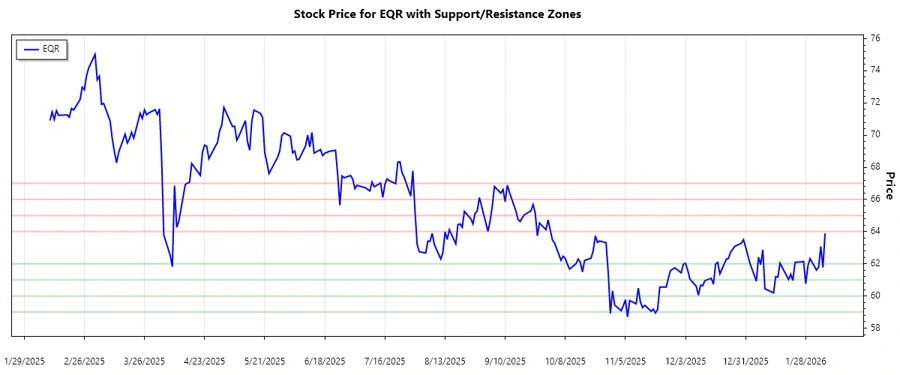
| Support | 61.00 | 62.00 |
| Support | 59.00 | 60.00 |
| Resistance | 64.00 | 65.00 |
| Resistance | 66.00 | 67.00 |
The current price is trading near a support zone, indicating potential buying interest and a potential bounce back if this level holds.
Conclusion
Currently, EQR is oscillating between established support and resistance levels. With predominant neutrality in recent trends, investors should closely monitor the 61.00 to 62.00 support range for potential buying signals. Meanwhile, resistance zones around 64.00 to 65.00 and higher at 66.00 to 67.00 could restrain upward movements. Analysts should remain cautious about sudden market shifts influenced by broader economic conditions or sector-specific news.