November 12, 2025 a 04:03 am
EQR: Trend and Support & Resistance Analysis - Equity Residential
Equity Residential, a key player in the residential property market, presents a mixed performance with recent downturns, making it vital for investors to watch ongoing trends and support levels. The stock has shown volatility, which can be both a risk and an opportunity depending on market conditions. Understanding the technical indicators and zones will be crucial for short to medium-term traders.
Trend Analysis
| Date | Close Price | Trend |
|---|---|---|
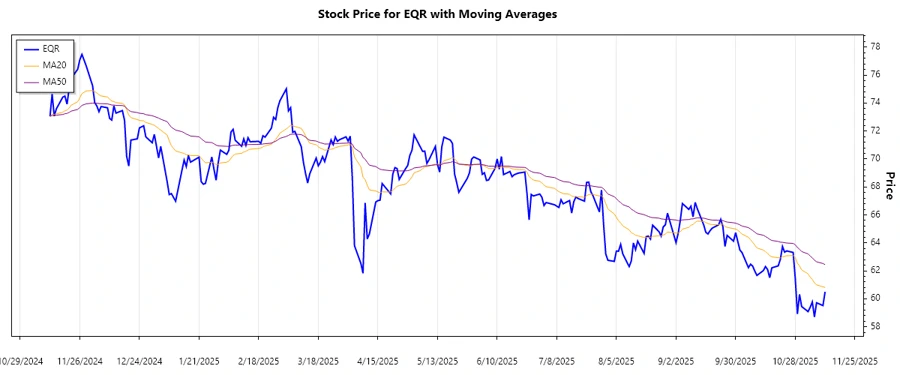
| 2025-11-11 | 60.49 | ▼ |
| 2025-11-10 | 59.51 | ▼ |
| 2025-11-07 | 59.71 | ▼ |
| 2025-11-06 | 58.70 | ▼ |
| 2025-11-05 | 59.77 | ▼ |
| 2025-11-04 | 59.38 | ▼ |
| 2025-11-03 | 59.08 | ▼ |
The technical analysis reveals a prevailing downward trend, evident as the EMA20 remains below the EMA50, suggesting bearish sentiment. This can serve as an indicator for traders to approach with caution.
Support- and Resistance
| Zone | From | To | Direction |
|---|---|---|---|
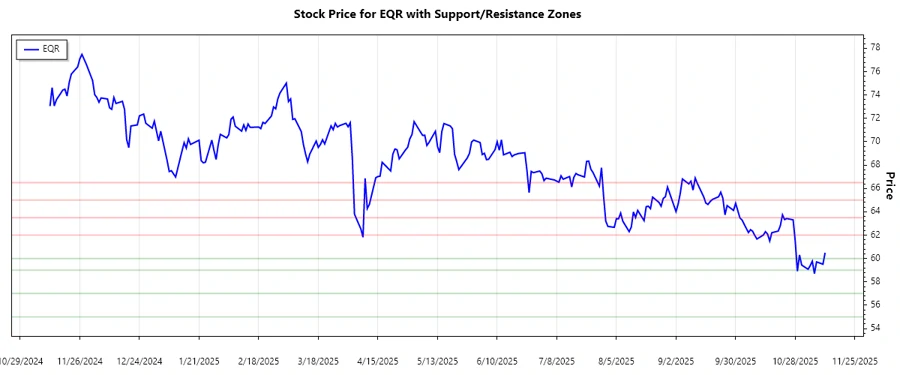
| Support 1 | 59.00 | 60.00 | 🔻 |
| Support 2 | 55.00 | 57.00 | 🔻 |
| Resistance 1 | 62.00 | 63.50 | 🔺 |
| Resistance 2 | 65.00 | 66.50 | 🔺 |
Currently, EQR is within the support zone 1, suggesting it may find a price floor here, but also indicating potential for breaching lower bounds if pressure continues. Technical traders should observe these levels closely to plan their strategies.
Conclusion
The current analysis highlights a bearish environment for Equity Residential, with key support levels under pressure. Traders should be vigilant for a potential breakthrough below the identified zones, which could signal deeper declines. Conversely, a recovery towards resistance levels may indicate stabilization. Opportunities exist for those monitoring these zones and applying disciplined strategies amidst prevailing market conditions.
Smart Data Insight
Master the Perfect Entry & Exit for this Stock
Don't leave your profits to chance. Historically, this stock follows specific seasonal patterns that institutional traders use to maximize returns.
- ✅ Identify the "Golden Buying Window"
- ✅ Avoid high-risk correction cycles
- ✅ Backtested data from the last 20+ years