August 27, 2025 a 10:15 am
EQR: Fibonacci Analysis - Equity Residential
Equity Residential (EQR) has shown robust activity within major urban areas, establishing itself as a significant player in the residential property market. Despite recent fluctuations, EQR remains focused on strategic acquisitions and development projects. With a presence in high-demand cities, the company is well-positioned for consistent demand, although macroeconomic factors may introduce elements of risk.
Fibonacci Analysis
| Detail | Information |
|---|---|
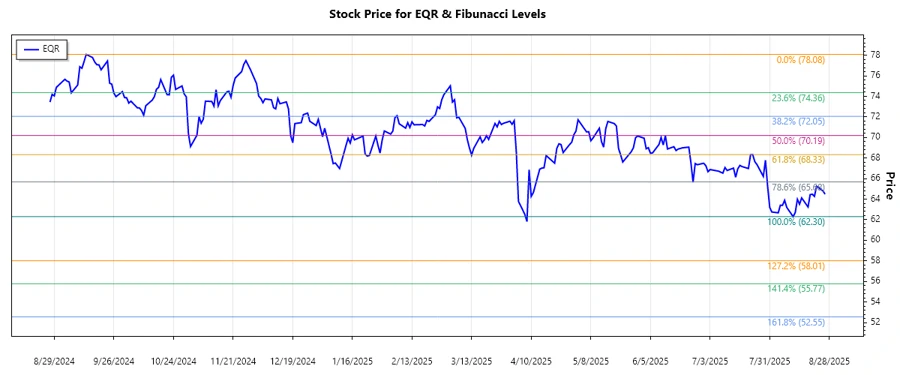
| Trend Start Date | 2024-12-02 |
| Trend End Date | 2025-08-26 |
| High Price and Date | $78.08 on 2024-09-13 |
| Low Price and Date | $62.30 on 2025-08-11 |
| Fibonacci Levels | |
| 0.236 level | $65.78 |
| 0.382 level | $68.23 |
| 0.5 level | $70.19 |
| 0.618 level | $72.15 |
| 0.786 level | $74.50 |
| Current Price Retracement Zone | 0.236 |
The current price is within the 0.236 retracement zone, indicating a possible initial resistance level at this price point. This can signal a critical level to watch for potential rebound or continuation of the downward trend, depending on market conditions.
Conclusion
Equity Residential (EQR) is in a position where technical analysis suggests monitoring the 0.236 Fibonacci retracement level closely. While the company shows strategic strength in urban markets, recent price movements could signal volatility, challenging investors to balance optimism with caution. The trend analysis reveals important potential support levels that could serve as buy zones if broader market data aligns. Risks remain tied to external economic factors and housing market dynamics.
Smart Data Insight
Master the Perfect Entry & Exit for this Stock
Don't leave your profits to chance. Historically, this stock follows specific seasonal patterns that institutional traders use to maximize returns.
- ✅ Identify the "Golden Buying Window"
- ✅ Avoid high-risk correction cycles
- ✅ Backtested data from the last 20+ years