June 14, 2025 a 06:44 am

EQR: Fibonacci Analysis - Equity Residential
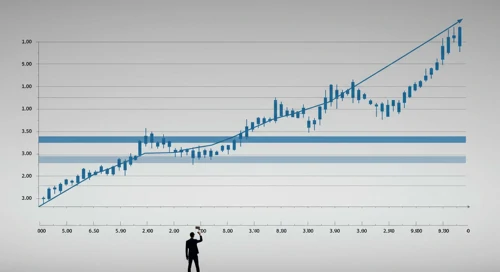
Equity Residential, a significant player in residential property management, shows promising potential given its strategic focus on dynamic urban centers. The recent price data indicates a period of volatility, yet the technical analysis reveals insights into future movements. Investors should be attentive to market dynamics as the stock trades near critical levels.
Fibonacci Analysis
| Detail | Value |
|---|---|
| Start Date | 2024-12-02 |
| End Date | 2025-06-13 |
| High Price | 77.48 on 2024-11-27 |
| Low Price | 61.82 on 2025-04-08 |
| Fibonacci Level | Price Level |
|---|---|
| 0.236 | 65.20 |
| 0.382 | 67.90 |
| 0.5 | 69.65 |
| 0.618 | 71.40 |
| 0.786 | 73.98 |
The current price of EQR is 68.88, placing it in the 0.382 Fibonacci retracement zone. This indicates a potential support level, and traders should look out for signs of price reversal or continuation.
Conclusion
Equity Residential shows potential for price stabilization at current levels, given the technical indicators from the Fibonacci analysis. The stock's behavior in the retracement zones may offer potential buying opportunities, especially if support levels maintain. However, investors should remain cautious of broader market volatility that could affect the overall momentum. Given these factors, the equity remains a viable candidate for technical traders watching key levels closely.
Smart Data Insight
Master the Perfect Entry & Exit for this Stock
Don't leave your profits to chance. Historically, this stock follows specific seasonal patterns that institutional traders use to maximize returns.
- ✅ Identify the "Golden Buying Window"
- ✅ Avoid high-risk correction cycles
- ✅ Backtested data from the last 20+ years