
July 26, 2026 a 12:46 pm

EQR: Dividend Analysis - Equity Residential
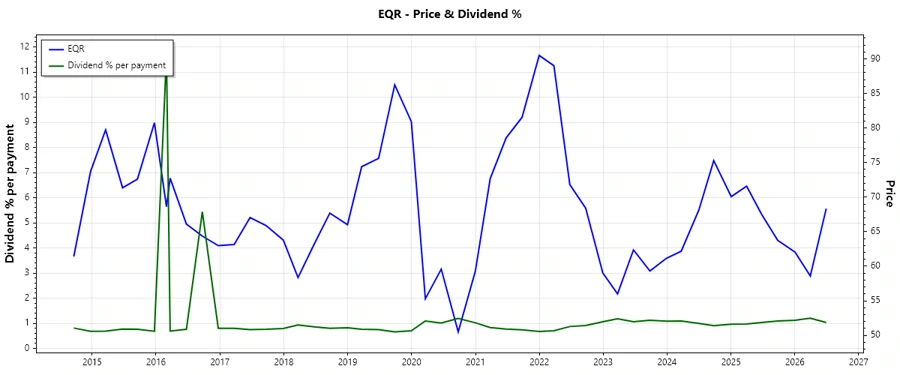
Equity Residential presents a compelling dividend profile over many years, with an impressive history of 34 years of dividend payouts without any recent cuts. However, the high payout ratio is concerning. In conjunction with stable dividend growth, it suggests that while shareholders enjoy returns, sustainability may be an issue without earnings growth.
📊 Overview
Equity Residential operates within the real estate sector, offering a competitive dividend yield. The company's sustained dividend history, with consistent increases over 34 years, signifies a committed approach to returning capital to shareholders.
| Metric | Detail |
|---|---|
| Sector | Real Estate |
| Dividend yield | 4.08 % |
| Current dividend per share | 2.76 USD |
| Dividend history | 34 years |
| Last cut or suspension | None |
🗣️ Dividend History
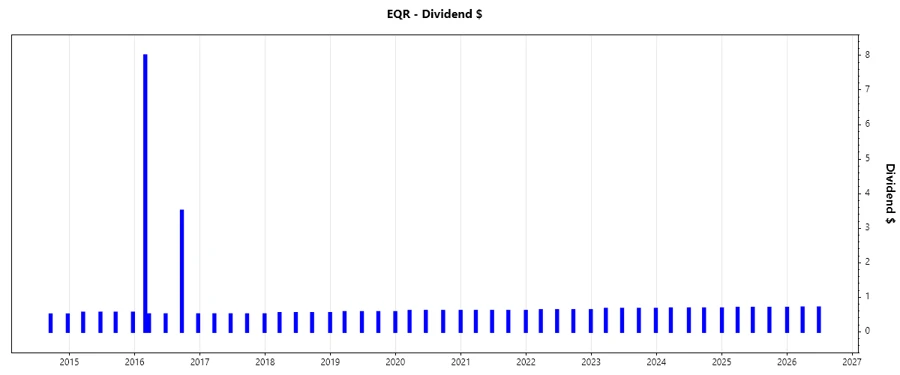
Equity Residential has consistently paid dividends, reflecting a strong commitment to shareholder returns. Reliable dividend history is crucial as it demonstrates the company's robust cash flow and earnings stability.
| Year | Dividend per Share (USD) |
|---|---|
| 2026 | 2.0975 |
| 2025 | 2.7525 |
| 2024 | 2.025 |
| 2023 | 2.6500 |
| 2022 | 2.500 |
📈 Dividend Growth
A robust dividend growth is a positive indicator of a company's potential for sustainable dividend increases. Monitoring growth over 3 to 5 years is essential for evaluating future earnings expansion.
| Time | Growth |
|---|---|
| 3 years | 3.26% |
| 5 years | 2.69% |
The average dividend growth is 2.69 % over 5 years. This shows moderate but steady dividend growth.
📉 Payout Ratio
Payout ratios help assess the sustainability of dividend payments. A high payout ratio may suggest less room for dividend increases unless earnings grow significantly.
| Key figure | Ratio |
|---|---|
| EPS-based | 120.72 % |
| Free cash flow-based | 104.51 % |
The payout ratios indicate dividends are paid from a high percentage of available earnings and cash flow, which implies potential risks in maintaining these payouts without earnings growth.
✅ Cashflow & Capital Efficiency
Evaluating cash flow stability and capital efficiency metrics like Free Cash Flow Yield and CAPEX ratios provides insight into operational effectiveness and sustainability of dividend payments.
| Metric | 2023 | 2024 | 2025 |
|---|---|---|---|
| Free Cash Flow Yield | 5.18% | 4.62% | 5.40% |
| Earnings Yield | 3.61% | 3.81% | 4.69% |
| CAPEX to Operating Cash Flow | 21.76% | 20.25% | 21.78% |
| Stock-based Compensation to Revenue | 1.11% | 1.05% | 0% |
| Free Cash Flow / Operating Cash Flow Ratio | 78.24% | 79.75% | 78.23% |
The cash flows suggest stable but constrained capital operation due to the significant amount allocated towards dividends.
⚠️ Balance Sheet & Leverage Analysis
Understanding leverage through ratios helps determine the company’s capacity to weather financial adversity and manage debt obligations.
| Metric | 2023 | 2024 | 2025 |
|---|---|---|---|
| Debt-to-Equity | 0.69 | 0.76 | 0.80 |
| Debt-to-Assets | 0.38 | 0.40 | 0.42 |
| Debt-to-Capital | 0.41 | 0.43 | 0.44 |
| Net Debt to EBITDA | 4.30 | 4.55 | 3.73 |
| Current Ratio | 0.17 | 0.16 | |
| Quick Ratio | 0.17 | 0.16 | 0.05 |
| Financial Leverage | 1.81 | 1.89 | 1.88 |
Equity Residential's leverage shows moderate levels, indicating a balanced but cautious approach to its capital structure, with a drive to manage debt liabilities prudently.
🗣️ Fundamental Strength & Profitability
Examining profitability metrics like ROE and margins offers insights into the financial health and ability to generate surplus returns for shareholders.
| Metric | 2023 | 2024 | 2025 |
|---|---|---|---|
| Return on Equity | 7.54% | 9.38% | 10.14% |
| Return on Assets | 4.17% | 4.97% | 5.40% |
| ROIC | 8.99% | 8.93% | 219.27% |
| Net Margin | 29.07% | 34.76% | 36.12% |
| EBIT Margin | 30.55% | 29.25% | 42.73% |
| EBITDA Margin | 61.92% | 61.69% | 75.41% |
| Gross Margin | 63.59% | 63.27% | 46.32% |
| R&D to Revenue | 0% | 0% | 0% |
The profitability metrics suggest strong financial performance, though sustainability over long periods could be influenced by external industry factors.
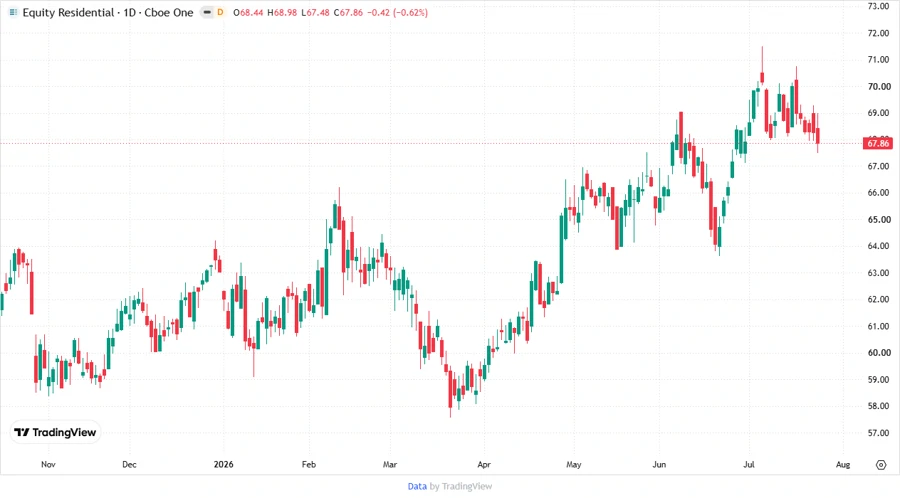
📉 Price Development
✅ Dividend Scoring System
| Criterion | Score | Bar |
|---|---|---|
| Dividend yield | 4 | |
| Dividend Stability | 5 | |
| Dividend growth | 3 | |
| Payout ratio | 2 | |
| Financial stability | 3 | |
| Dividend continuity | 5 | |
| Cashflow Coverage | 3 | |
| Balance Sheet Quality | 4 |
Total Score: 29 / 40
⚠️ Rating
The final evaluation positions Equity Residential as a reliable dividend payer due to its consistency in past dividend payouts and moderate growth. However, the elevated payout ratios present a potential caveat, warranting close monitoring of financial results and leveraging adjustments. Recommendations are inclined towards a cautious approach, emphasizing a balanced investment consideration for dividend-oriented portfolios.
Smart Data Insight
Master the Perfect Entry & Exit for this Stock
Don't leave your profits to chance. Historically, this stock follows specific seasonal patterns that institutional traders use to maximize returns.
- ✅ Identify the "Golden Buying Window"
- ✅ Avoid high-risk correction cycles
- ✅ Backtested data from the last 20+ years