
July 20, 2026 a 07:31 am


EQR: Dividend Analysis - Equity Residential
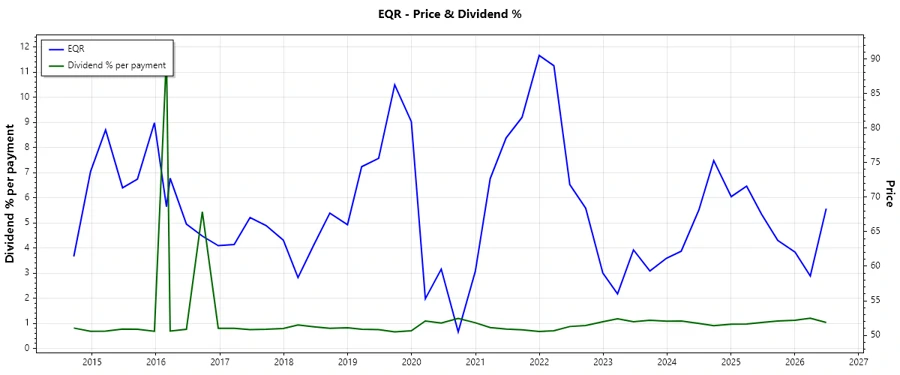
The dividend profile for Equity Residential demonstrates a consistent and reliable history, making it a potential choice for dividend-focused investors. With a yield of approximately 4.08%, it's considered appealing in the current market environment. However, its payout ratios suggest potential cash flow challenges. Investors should consider the sustainability of its dividend policy.
📊 Overview
Equity Residential operates in the real estate sector, offering a solid dividend yield amidst market fluctuations. With a 34-year track record of dividend payouts, the company showcases stability, though emphasis is needed on managing payout ratios efficiently.
| Metric | Value |
|---|---|
| Sector | Real Estate |
| Dividend yield | 4.08 % |
| Current dividend per share | 2.76 USD |
| Dividend history | 34 years |
| Last cut or suspension | None |
🗣️ Dividend History
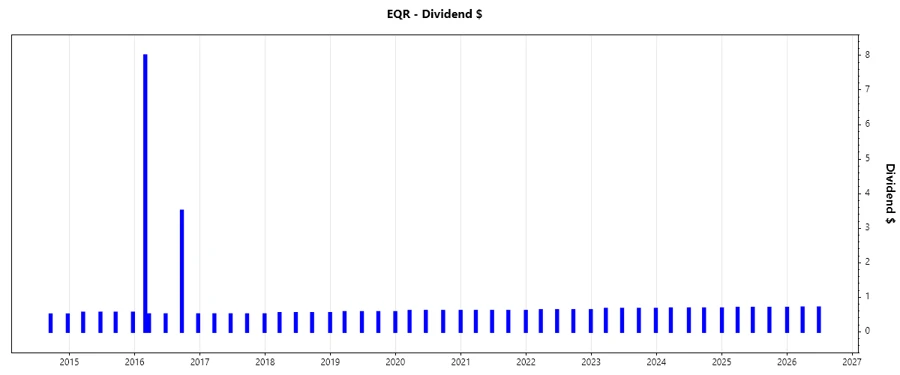
Equity Residential has proven resilient with its dividend history, showcasing stability even during economic downturns. Long histories like these are crucial as they indicate reliable income for shareholders.
| Year | Dividend per Share (USD) |
|---|---|
| 2026 | 2.0975 |
| 2025 | 2.7525 |
| 2024 | 2.025 |
| 2023 | 2.65 |
| 2022 | 2.50 |
📈 Dividend Growth
Continuous dividend growth is pivotal to hedge against inflation and increase income over time. Equity Residential has demonstrated moderate growth, reflective of its planned strategic expansions and reinvestments.
| Time | Growth |
|---|---|
| 3 years | 3.26 % |
| 5 years | 2.69 % |
The average dividend growth is 2.69% over 5 years. This shows moderate but steady dividend growth.
📉 Payout Ratio
The payout ratio gives us insights into how well earnings cover dividend payments. Elevation beyond 100% is a caution signal, though temporary spikes can be innocuous if cash flow supports them.
| Key figure | Ratio |
|---|---|
| EPS-based | 108.86 % |
| Free cash flow-based | 81.82 % |
The EPS-based payout ratio of 108.86% signifies overextension, suggesting dividends may exceed earnings sustainability. However, the FCF-based figure is more favorable at 81.82%, indicating better cash coverage.
✅ Cashflow & Capital Efficiency
Efficient use of capital and robust cash flows are paramount for dividend sustainability and potential growth. While Equity Residential shows positivity in cash flow yields, some capital efficiency ratios warrant attention for potential strategic adjustments.
| Metric | 2023 | 2024 | 2025 |
|---|---|---|---|
| Free Cash Flow Yield | 5.18 % | 4.62 % | 5.40 % |
| Earnings Yield | 3.61 % | 4.69 % | 4.69 % |
| CAPEX to Operating Cash Flow | 21.76 % | 20.25 % | 21.78 % |
| Stock-based Compensation to Revenue | 1.11 % | 1.05 % | 0 % |
| Free Cash Flow / Operating Cash Flow Ratio | 78.24 % | 79.75 % | 78.22 % |
The cash flow metrics reflect adequate coverage and capital utilization. Improvements in CAPEX management could further enhance cash efficiency.
⚠️ Balance Sheet & Leverage Analysis
A prudent balance sheet is fundamental for sustaining operations and financing growth initiatives. Here, management of leverage and liquidity is key to fiscal resilience.
| Metric | 2023 | 2024 | 2025 |
|---|---|---|---|
| Debt-to-Equity | 69.48 % | 76.30 % | 79.56 % |
| Debt-to-Assets | 38.44 % | 40.44 % | 42.34 % |
| Debt-to-Capital | 40.99 % | 43.28 % | 44.31 % |
| Net Debt to EBITDA | 4.30x | 4.55x | 3.73x |
| Current Ratio | 0.17 | 0.16 | 0.05 |
| Quick Ratio | 0.17 | 0.16 | 0.05 |
| Financial Leverage | 180.72 % | 188.64 % | 187.89 % |
The ratios highlight manageable leverage, but liquidity ratios are less reassuring, emphasizing the need for bolstered current asset liquidity.
🏦 Fundamental Strength & Profitability
Foundational strength is seen in its ability to generate returns effectively. Stable profitability ratios hint at long-term viability, although monitoring operating efficiency is crucial.
| Metric | 2023 | 2024 | 2025 |
|---|---|---|---|
| Return on Equity | 7.54 % | 9.38 % | 10.14 % |
| Return on Assets | 4.17 % | 4.97 % | 5.40 % |
| Margins: Net | 29.07 % | 34.76 % | 36.12 % |
| Margins: EBIT | 30.55 % | 29.25 % | 42.73 % |
| Margins: EBITDA | 61.92 % | 61.69 % | 75.41 % |
| Margins: Gross | 63.59 % | 63.27 % | 46.32 % |
| R&D to Revenue | 0 % | 0 % | 0 % |
Profitability metrics point to a robust core operation, with healthy returns on equity and assets, affirming its competitive position and operational efficacy.
📉 Price Development
🎯 Dividend Scoring System
| Category | Score | Visual |
|---|---|---|
| Dividend yield | 4 | |
| Dividend Stability | 5 | |
| Dividend growth | 3 | |
| Payout ratio | 2 | |
| Financial stability | 3 | |
| Dividend continuity | 5 | |
| Cashflow Coverage | 3 | |
| Balance Sheet Quality | 3 |
Total Score: 28/40
⭐ Rating
Equity Residential proves to be a reliable dividend payer with a commendable history of continuous payouts and moderate growth. Despite high payout ratios presenting some concerns, the dividend yield coupled with a stable financial backdrop suggests a strong candidate for income-focused portfolios, especially if existing liquidity is improved. Cautious optimism is advised, with recommendations to hold and monitor liquidity health.
Smart Data Insight
Master the Perfect Entry & Exit for this Stock
Don't leave your profits to chance. Historically, this stock follows specific seasonal patterns that institutional traders use to maximize returns.
- ✅ Identify the "Golden Buying Window"
- ✅ Avoid high-risk correction cycles
- ✅ Backtested data from the last 20+ years